
Cloud risks arise across multiple layers and dimensions: (1) infrastructure such as compute, networks, storage, and identities; (2) applications and their API or service-to-service communications; and (3) the dependencies that link them together, including vulnerabilities, secrets, and sensitive data flows.
Upwind’s Graph Inventory overlays cloud assets, configurations, SBOMs, runtime sensor & cloud activity logs signals, and technologies into a unified graph database, providing an accurate foundation for understanding relationships and exposure.
However, even with this depth of correlation, teams still struggle to interpret risk at scale and understand how issues connect inside real environments. The Upwind Runtime Map demonstrated that visualizing the graph dramatically improves clarity, enabling users to map topologies, zoom in, group infrastructure logically, and navigate complex systems with ease.
That’s why we are excited today to introduce in Private Preview the Upwind Asset Map, which extends our graph capabilities, delivering a unified, organization-wide view of all inventory and all risk-related resources. This results in a dramatically improved security engineering experience and provides a shared language for engineers, DevOps, and security teams to identify and fix risks in the most efficient way possible.
The New Kitchen Table for Security, Engineering & DevOps
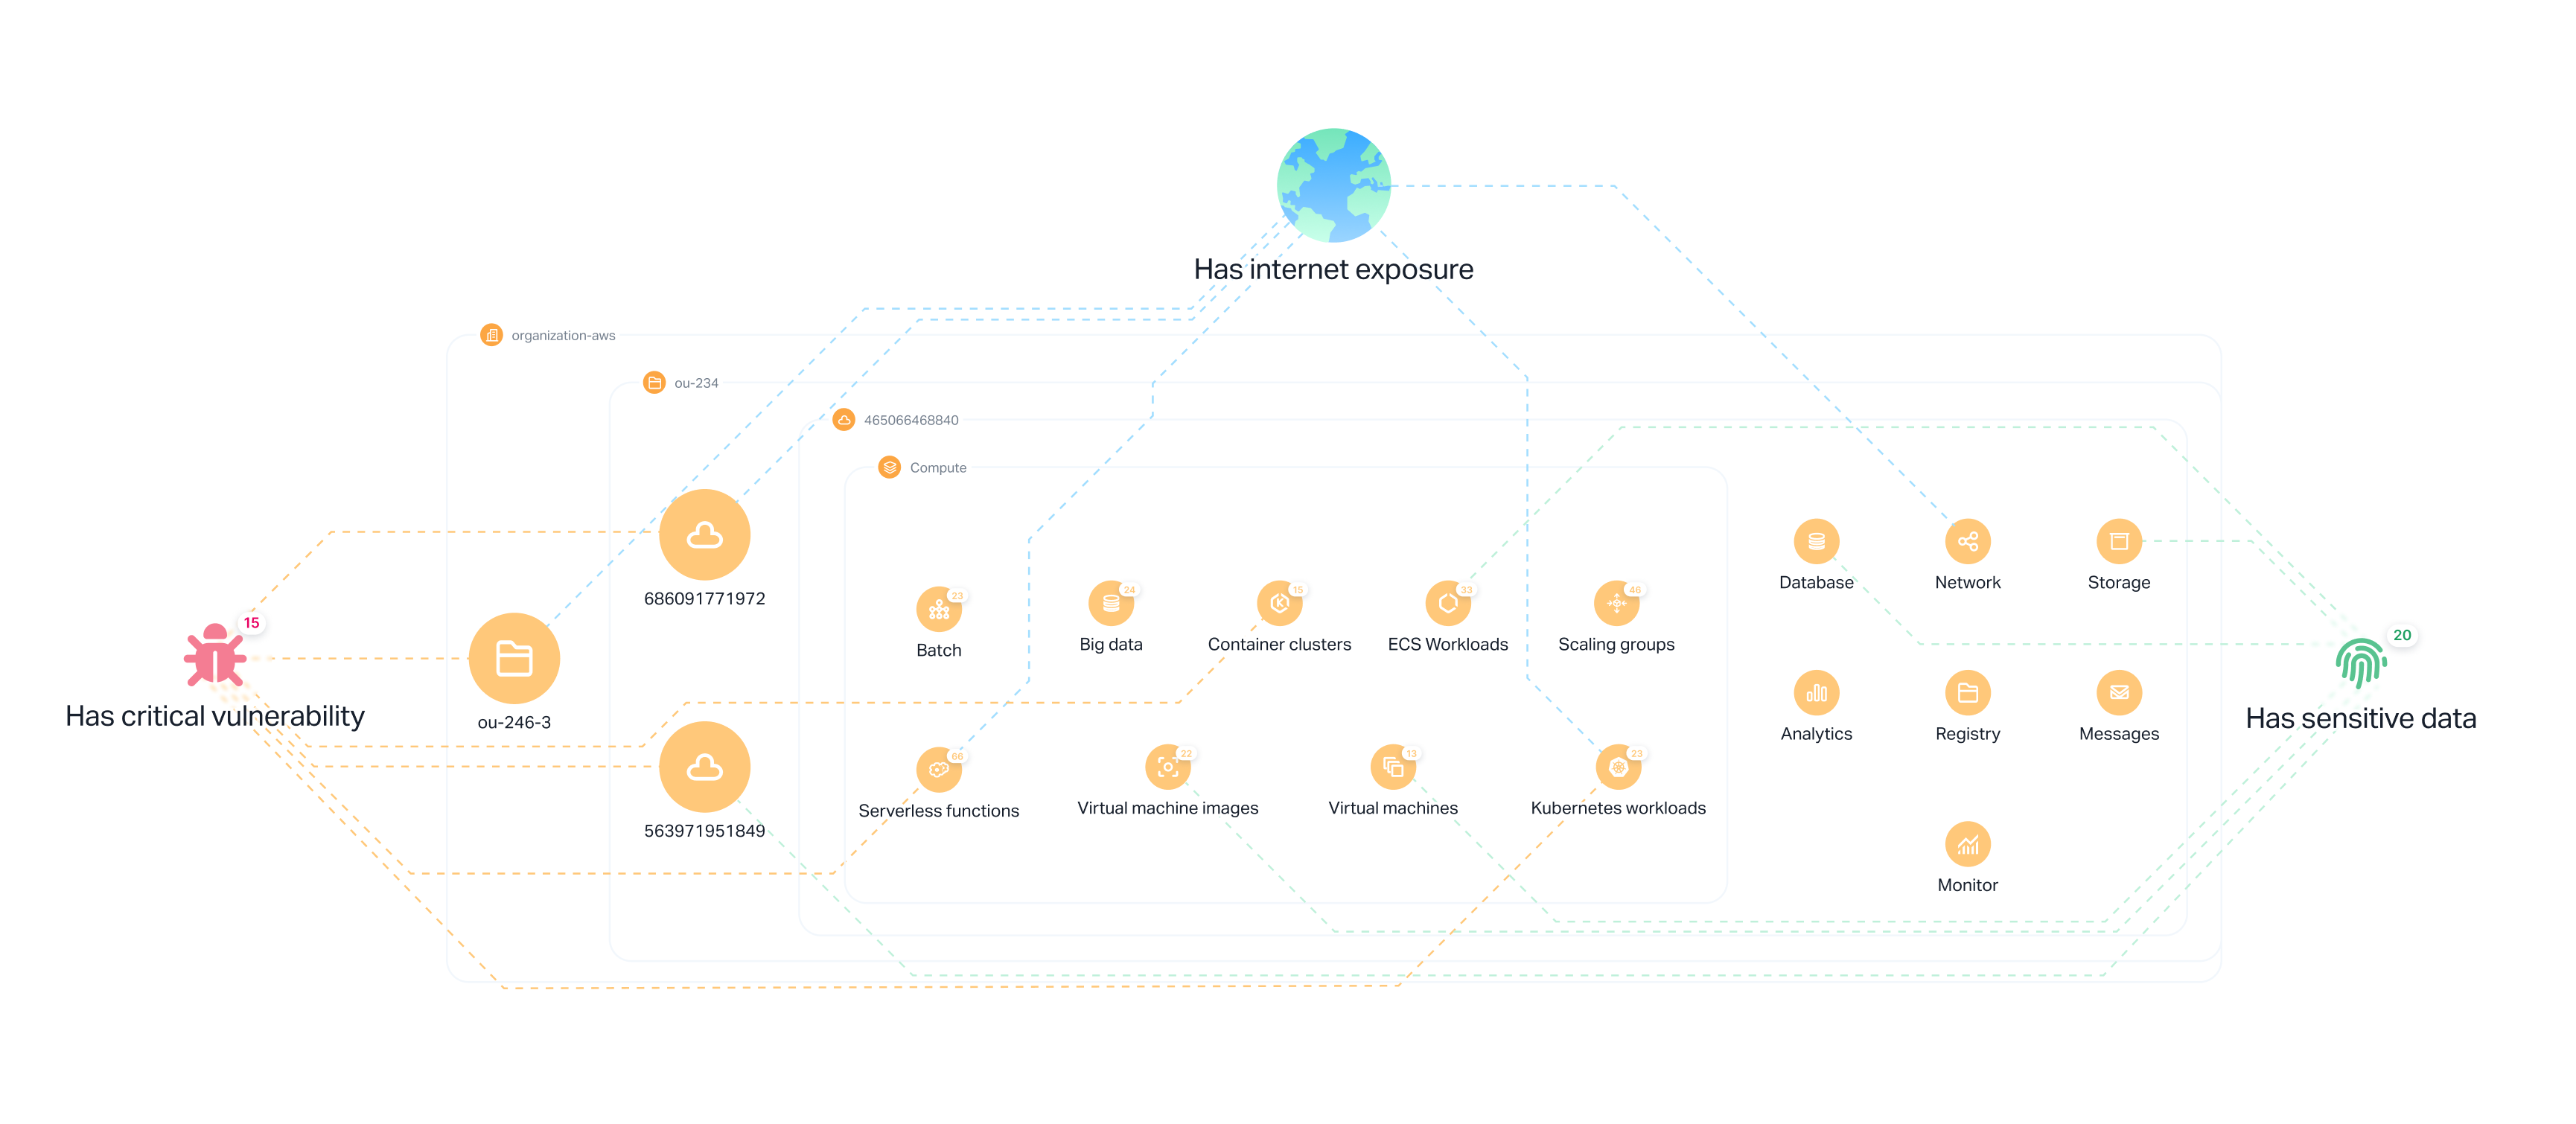
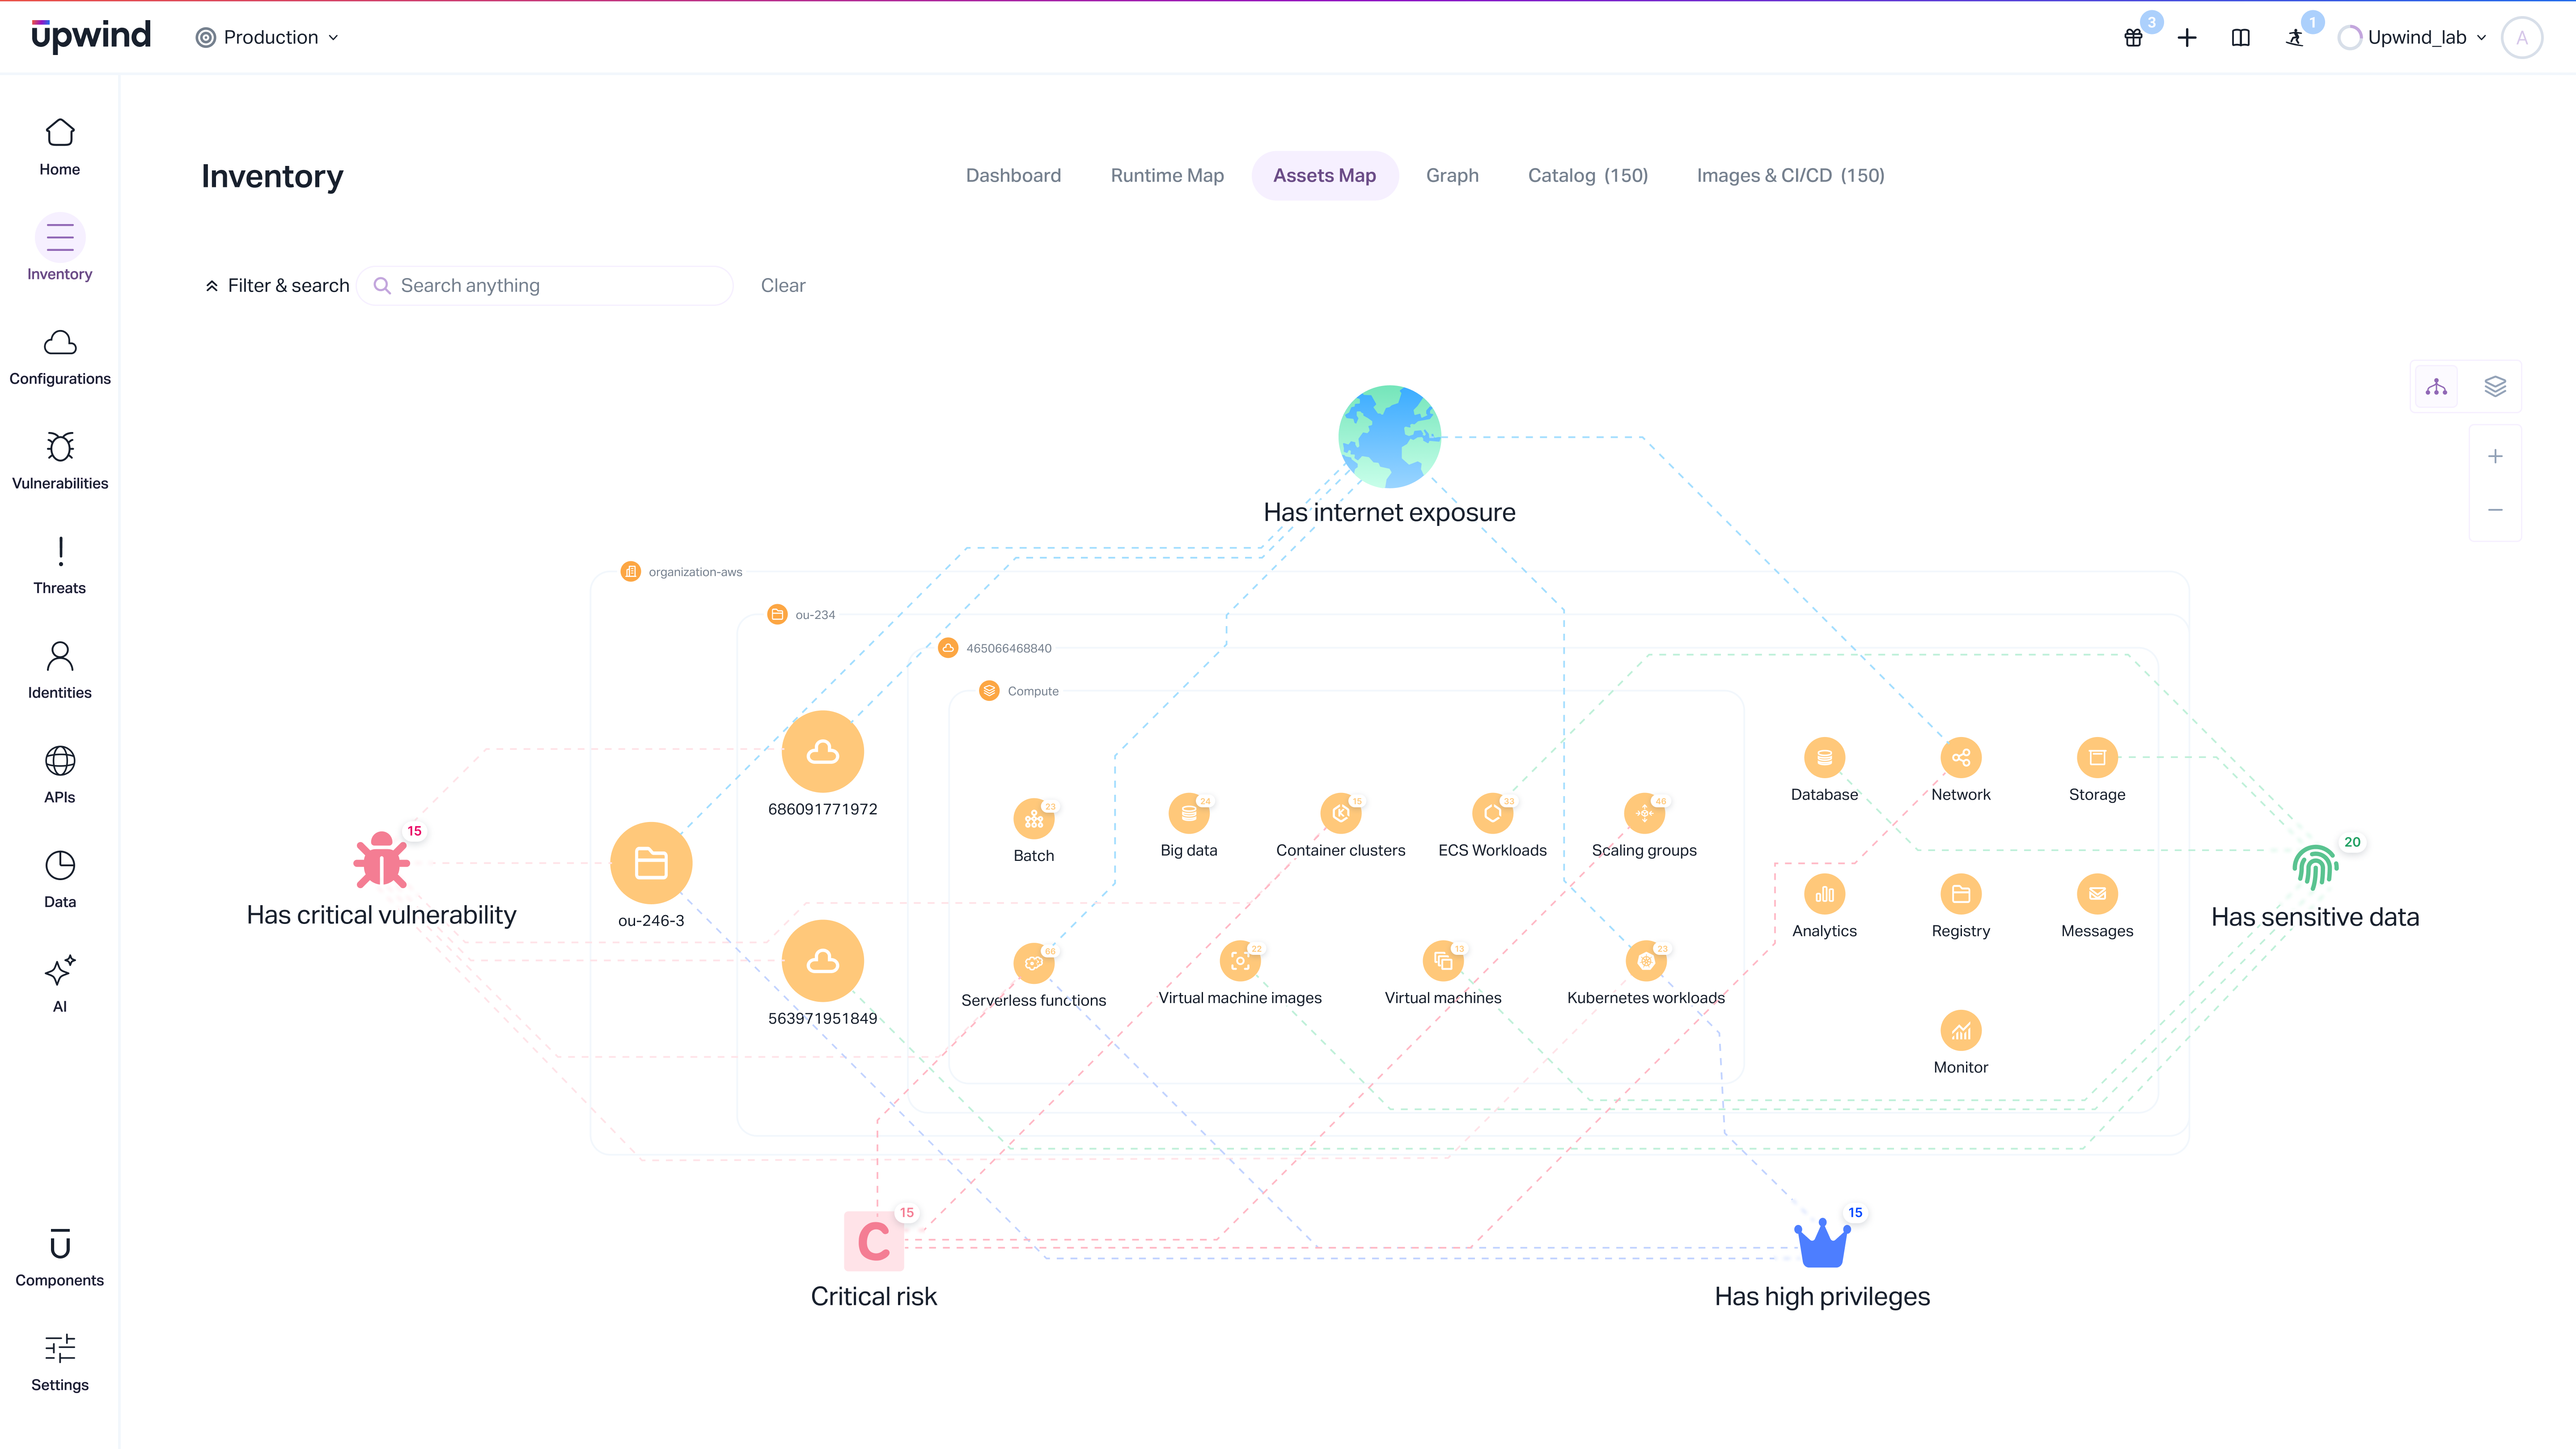
The Asset Map visualizes cloud architecture, identity relationships, exposure paths, vulnerabilities, data flows, and policy behavior in a logically grouped model that is navigable from cloud accounts and OUs down to individual assets.
It supports two complementary modes: a standalone architectural map and a query-driven map within the Inventory Graph tab.

A New “Asset Map” Under the Inventory Module
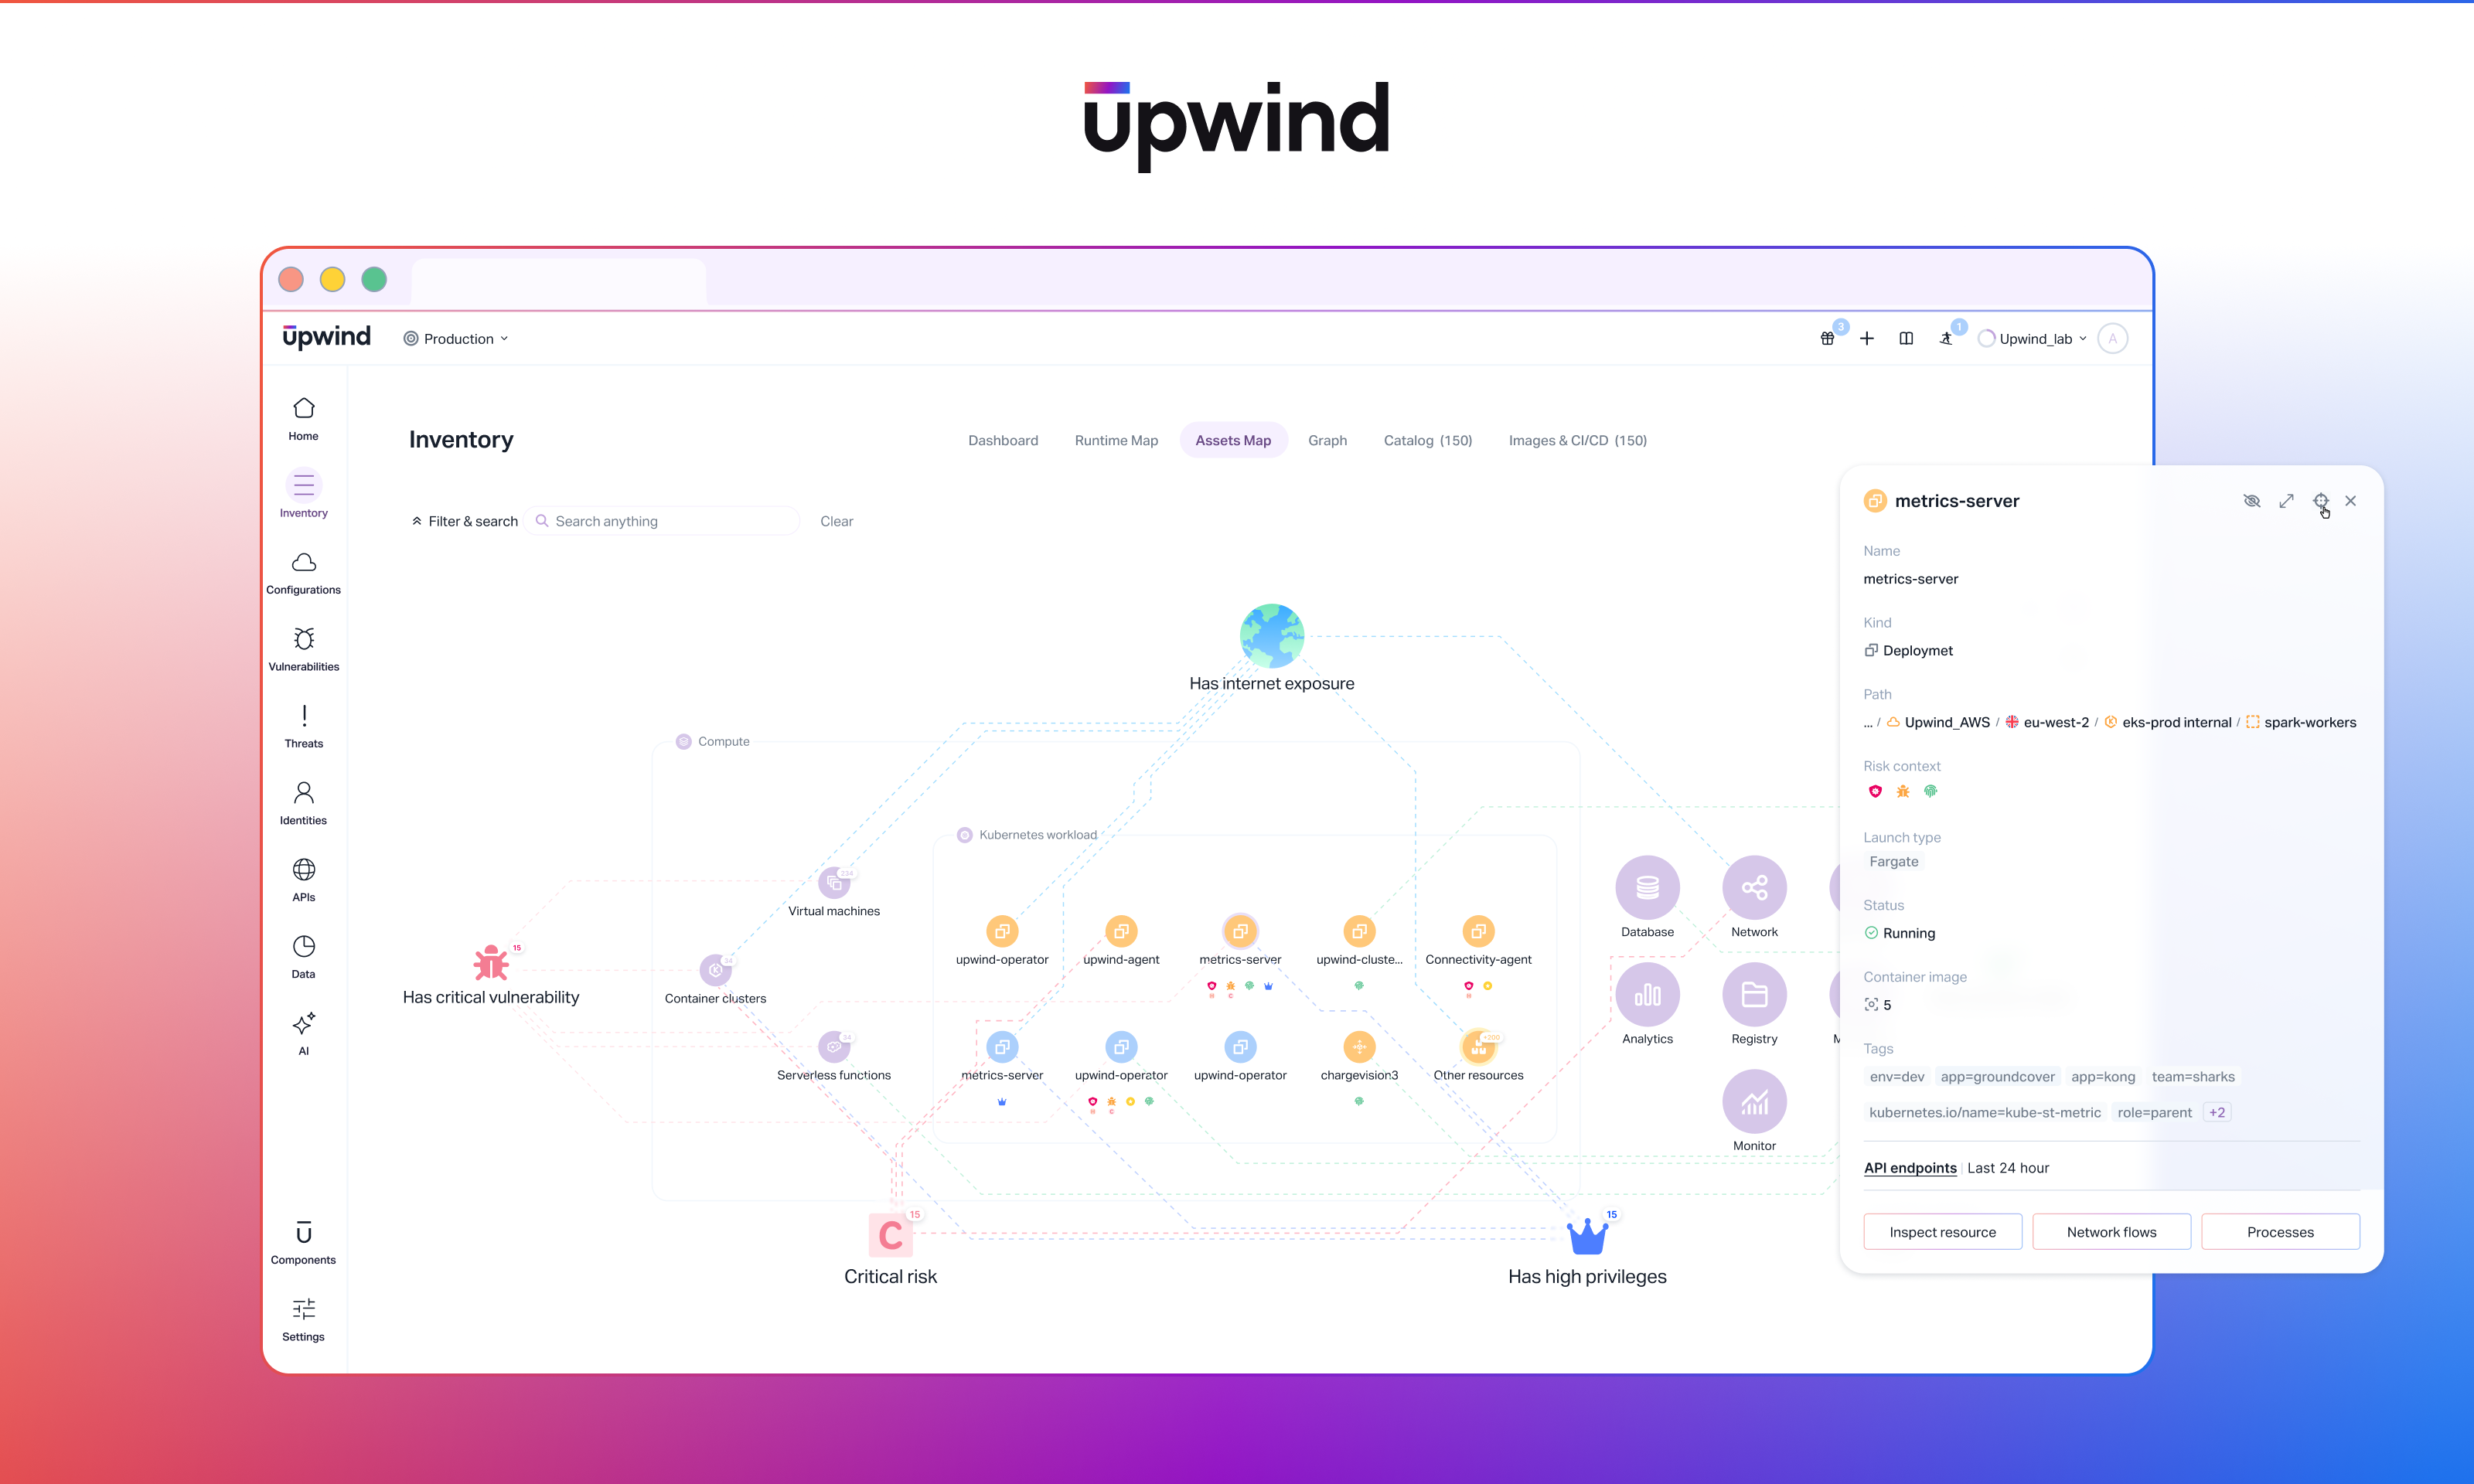
An interactive, layered asset mapping that combines a dynamic visualization canvas with search, navigation, and contextual information panels that lets users explore real world cloud infrastructure services , zoom in, correlate information and understand real-world exposure paths and applications. It is built around several key concepts and it is continuously updated and provides a global cloud map that includes:
- Accounts and OUs
- Compute, storage, network, and data services
- Containers, clusters, and Kubernetes components
- Identity relationships and permission paths
- Exposure paths
- Inventory-derived risks, SBOM insights, and configuration state

This view provides a complete architectural model for posture validation, investigation, and understanding how the environment is organized.
The Graph Tab Has Been Upgraded With Map-based Results to Queries
Any query generated in the Graph Tab can be visualized in context, showing:
- Dependencies
- Risks
- Network relationships and exposure routes
- Identity access paths and reachable surfaces
- Vulnerabilities, sensitive data, and runtime context
- Service communications across clusters and accounts
Use cases include:
- Finding containers running Python, exposed to the internet, handling sensitive data, and operating with elevated privileges
- Seeing which policy violations include resources that also have exploitable vulnerabilities and handle sensitive data and
- Identifying assets that match risk conditions across infrastructure, identity, and runtime behavior
Together, these two methods of viewing the Asset Map give teams the ability to understand both the full architecture and any specific queries with accurate context.
Multi-Layer Visibility From Organization to Resource
The new Asset Map scales across multiple levels of detail:
Organization & Account Level
- Cross-account connectivity and shared exposure
- Inherited misconfigurations and identity sprawl
- Risk concentrations across accounts or OUs
Infrastructure & Service Layer
- Compute, storage, identity, network, and data services
- Runtime correlation of configuration state and behavior
- Combined risk factors representing real exploitability
Workload-Level & Runtime Detail
- Misconfigurations
- Internet exposure
- Network and identity controls
- Sensitive data
- Exploitability of CVEs
- Ingress paths, Kubernetes operators, and service exposure

This allows teams to identify not only isolated findings, but exploitable combinations of misconfigurations, vulnerabilities, permissions, and data paths.
Why This Matters for Security Leaders
For security leaders, the primary challenge is understanding how configuration, identity, workload behavior, and policy enforcement intersect.
The Upwind Asset Map provides:
• comprehensive asset visibility
• accurate mapping of identity and network exposure paths
• the ability to see how vulnerabilities, misconfigurations, and data exposure combine into actual attack paths
This centralizes architectural understanding and accelerates investigation, prioritization, and remediation across engineering, DevOps, and security teams.
Now in Private Preview: A modern, Shared Decision-making Space for Security, Engineering, and DevOps to Solve Cloud Risk
The Upwind Asset Map gives organizations a complete view of their cloud inventory and associated risks. With both a standalone architectural map and a query-driven investigative map, teams gain a continuously updated, runtime-grounded understanding of how their environment is built and where real exposure exists.
To participate in the Private Preview and learn more about the Upwind Asset Map and how to leverage it for complete visibility of your cloud assets and risks, schedule a demo today.