Visibility That Drives Action: Evolving the Upwind Home Dashboard

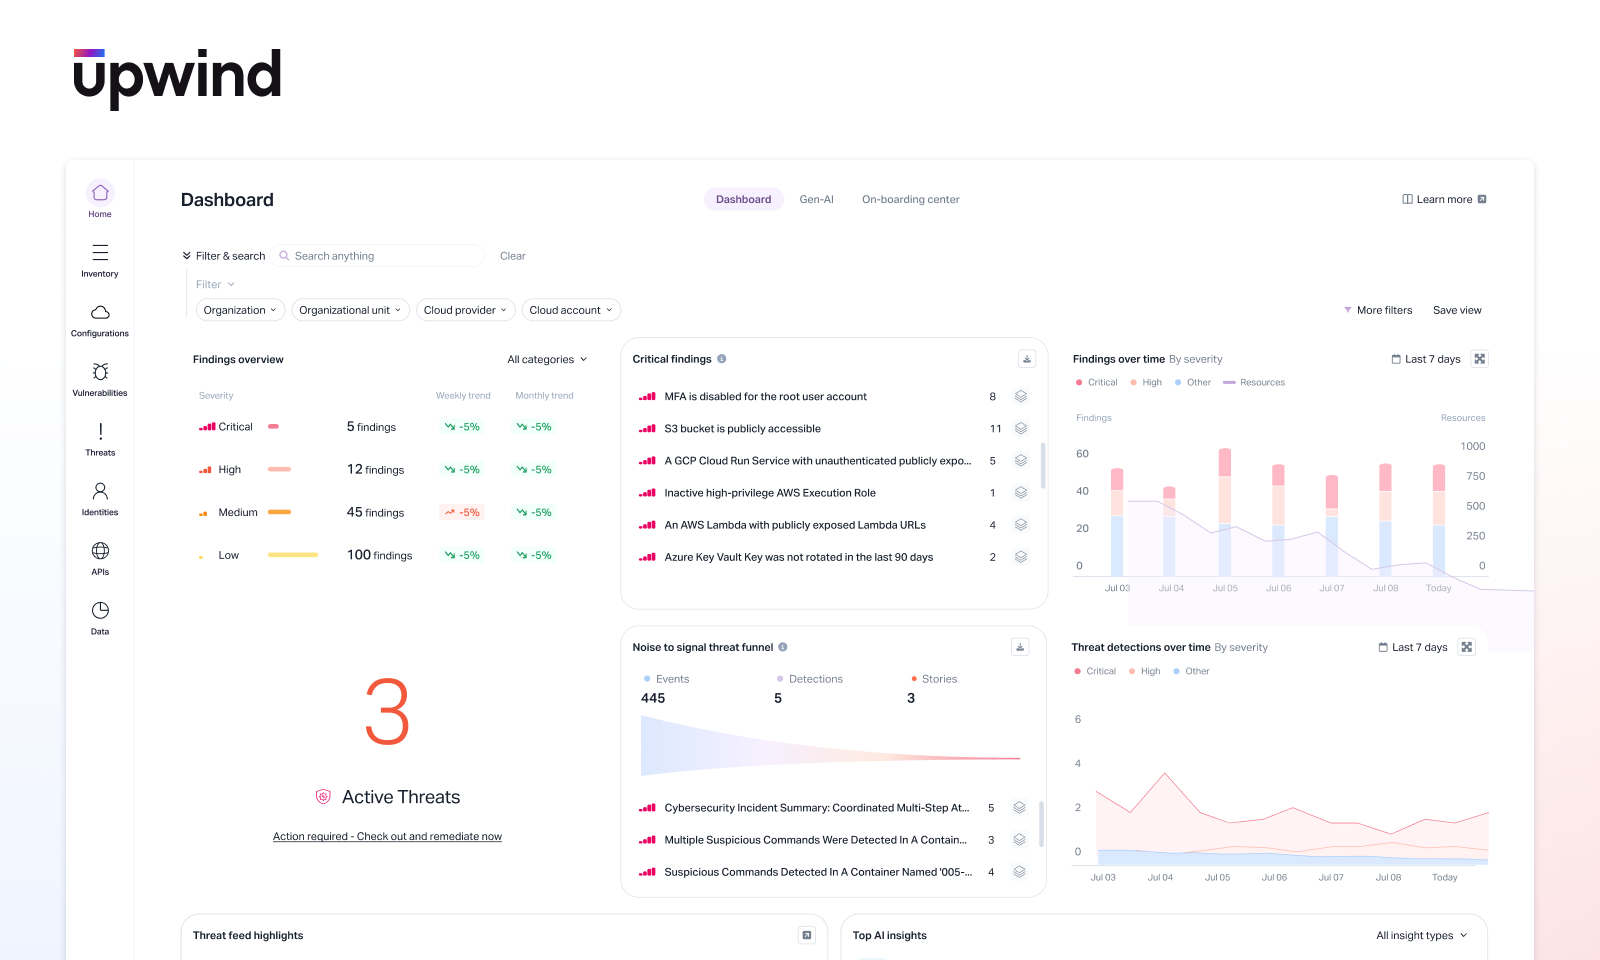
In cloud security, visibility without prioritization creates noise – and that’s why ever aspect of our product is designed to bring actionable value. For this reason, we are excited to announce enhancements to the the Upwind Home Dashboard, making it even easier to immediately understand the state of an environment and which security findings should be prioritized for remediation.
The Home Dashboard has always been more than just a landing page – it’s the first mile of the product experience and the front line of visibility. And like everything in the cloud, it’s constantly evolving, because the pace of modern infrastructure demands relentless refinement. We believe in continuous improvement, driven by how real teams work and what they need to move faster with greater clarity.
This latest evolution of the Home Dashboard reflects that mindset. It sharpens our focus on what matters, brings runtime context to the forefront, and helps you move from awareness to action in less time and with more confidence. Let’s take a closer look at what’s changed and why.
Precision from the Start: Context-Aware Navigation
Security teams operate across a wide range of scopes such as cloud providers, business units, resource groups, and accounts. Our updated filter and search panel embraces this diversity. It lets every user, from individual engineers to organization-wide security leads, instantly adapt the dashboard to reflect their specific responsibilities.
By tailoring the dashboard view to the user area of focus, we turn sprawling infrastructure into manageable segments. That means less noise, better focus, and smarter prioritization from the very first click.

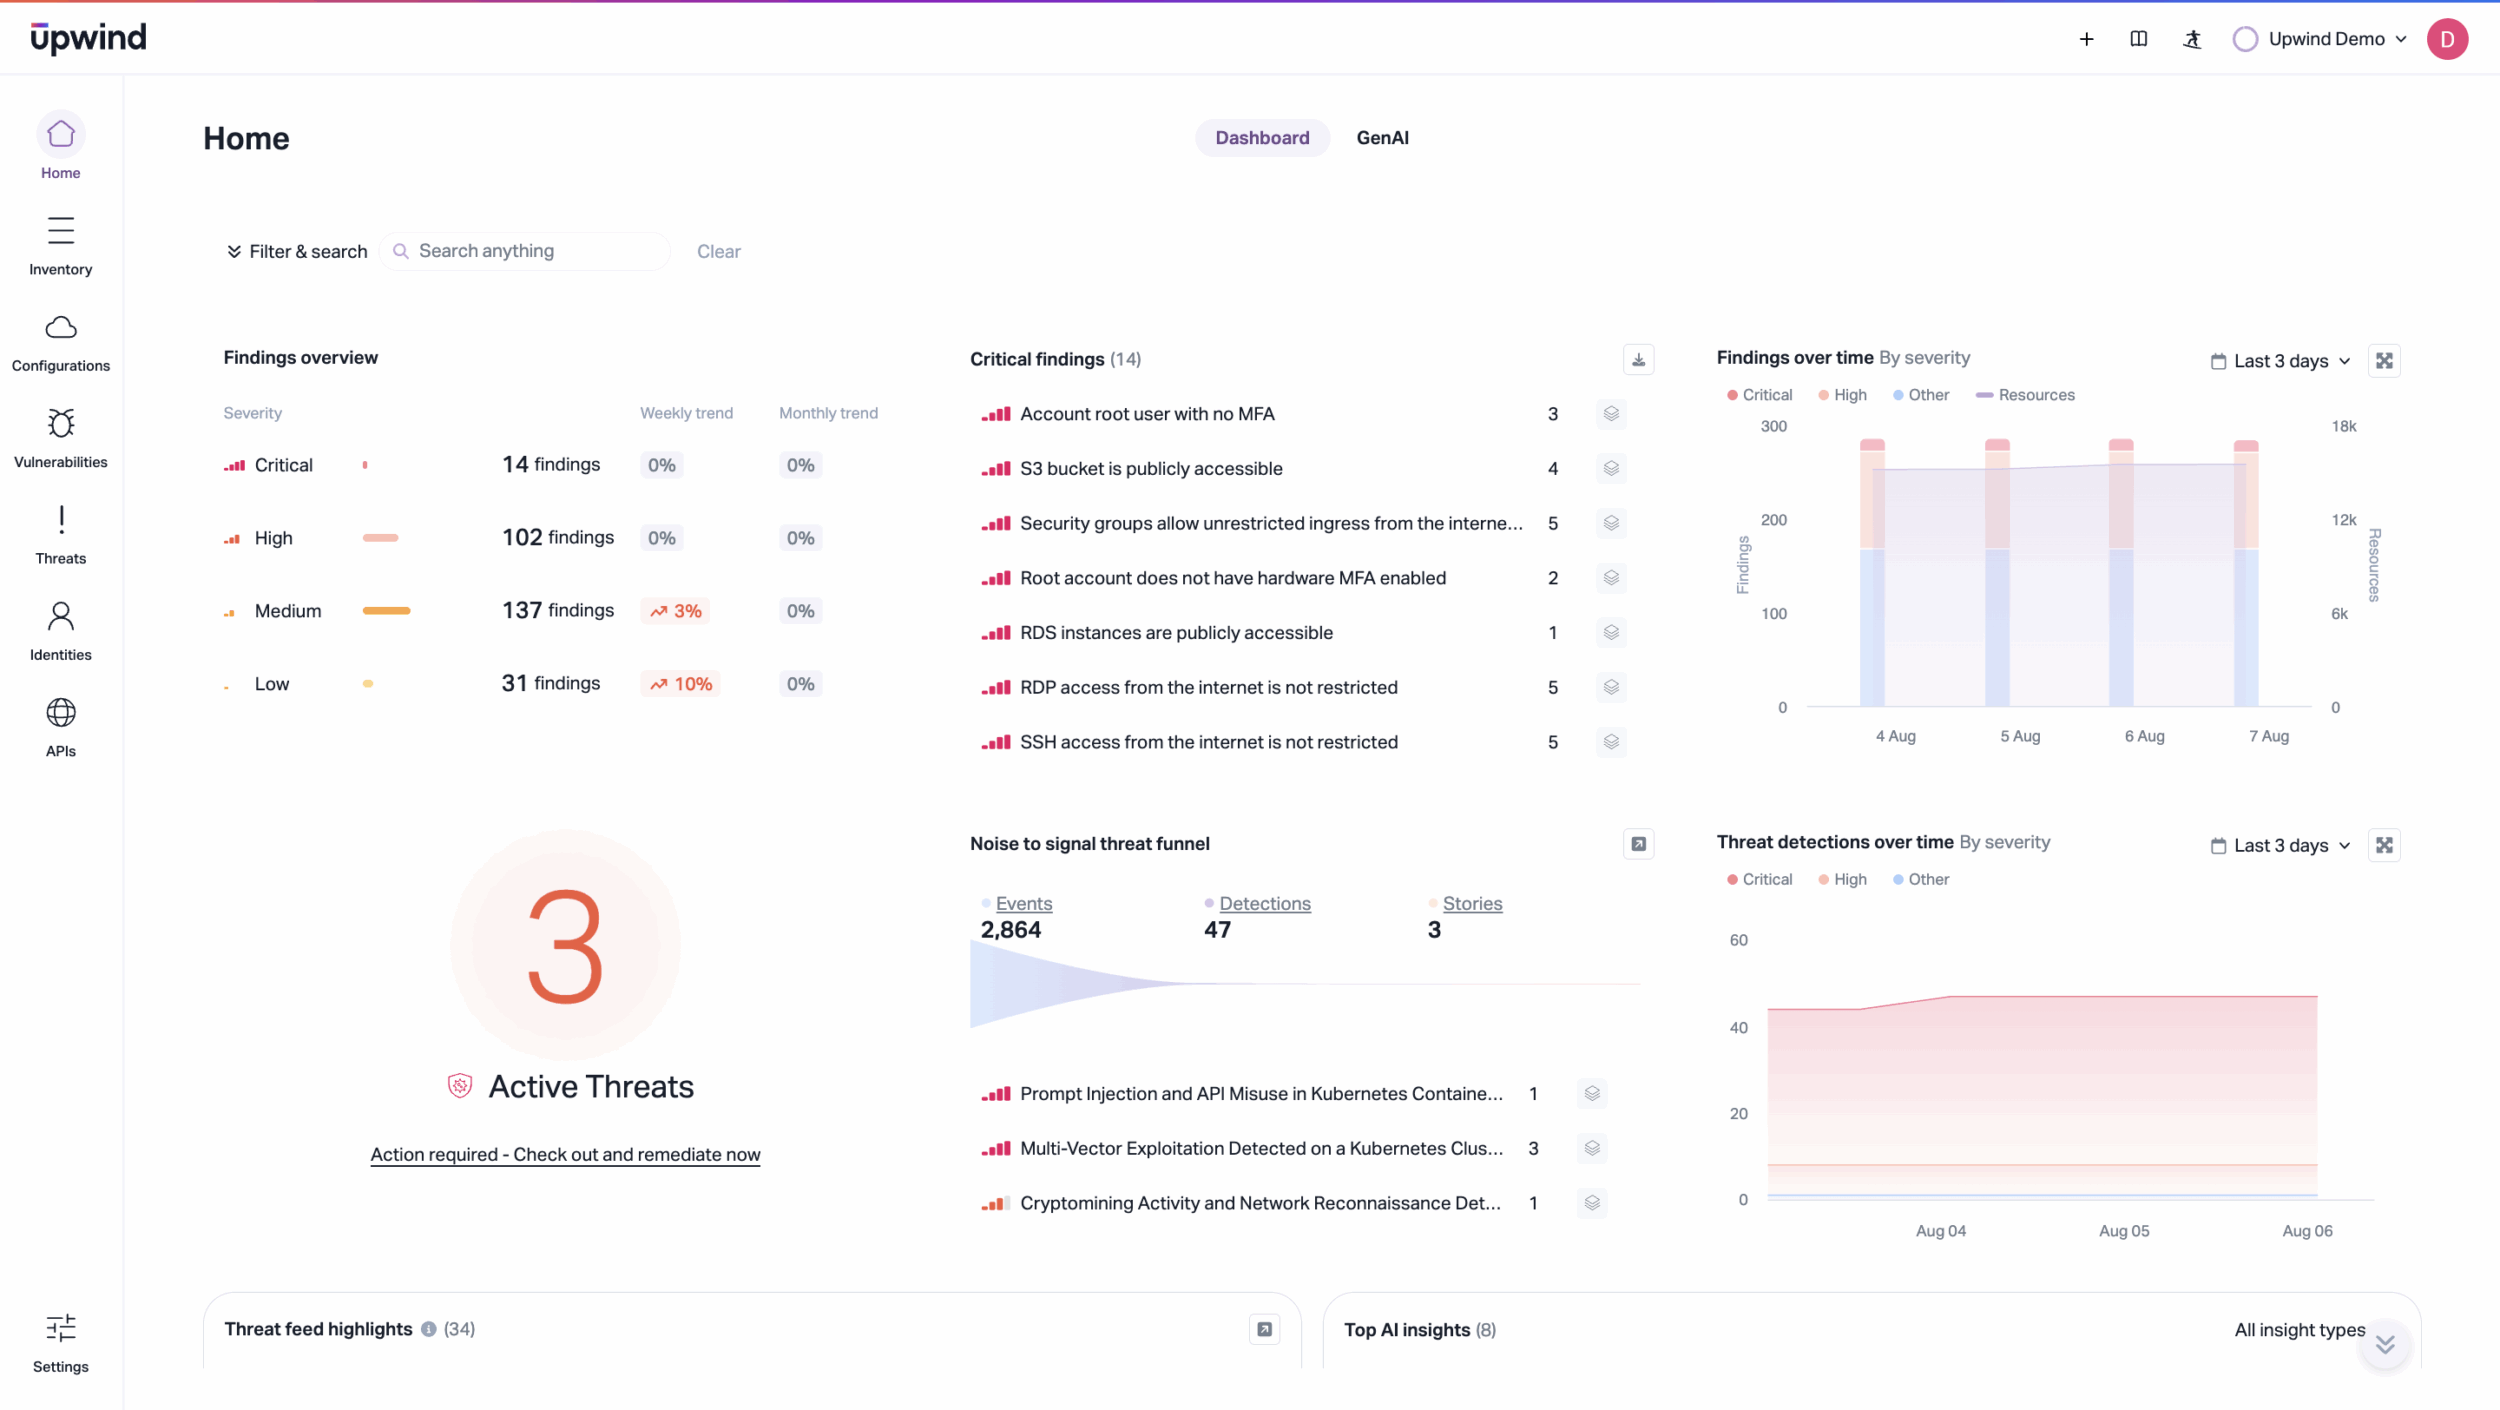
Posture at a Glance: Insights, Not Just Inventory
The Findings Overview offers a snapshot of your current cloud risk, but it also answers a deeper question: are we getting better or worse? With new visibility into weekly and monthly trends, teams can quickly see where posture is improving, where regressions are creeping in, and where attention is needed next. Instead of forcing users to dig through raw data, the dashboard brings the signal forward. It highlights what matters most, so you can track the real impact of remediation efforts and drive informed decisions.
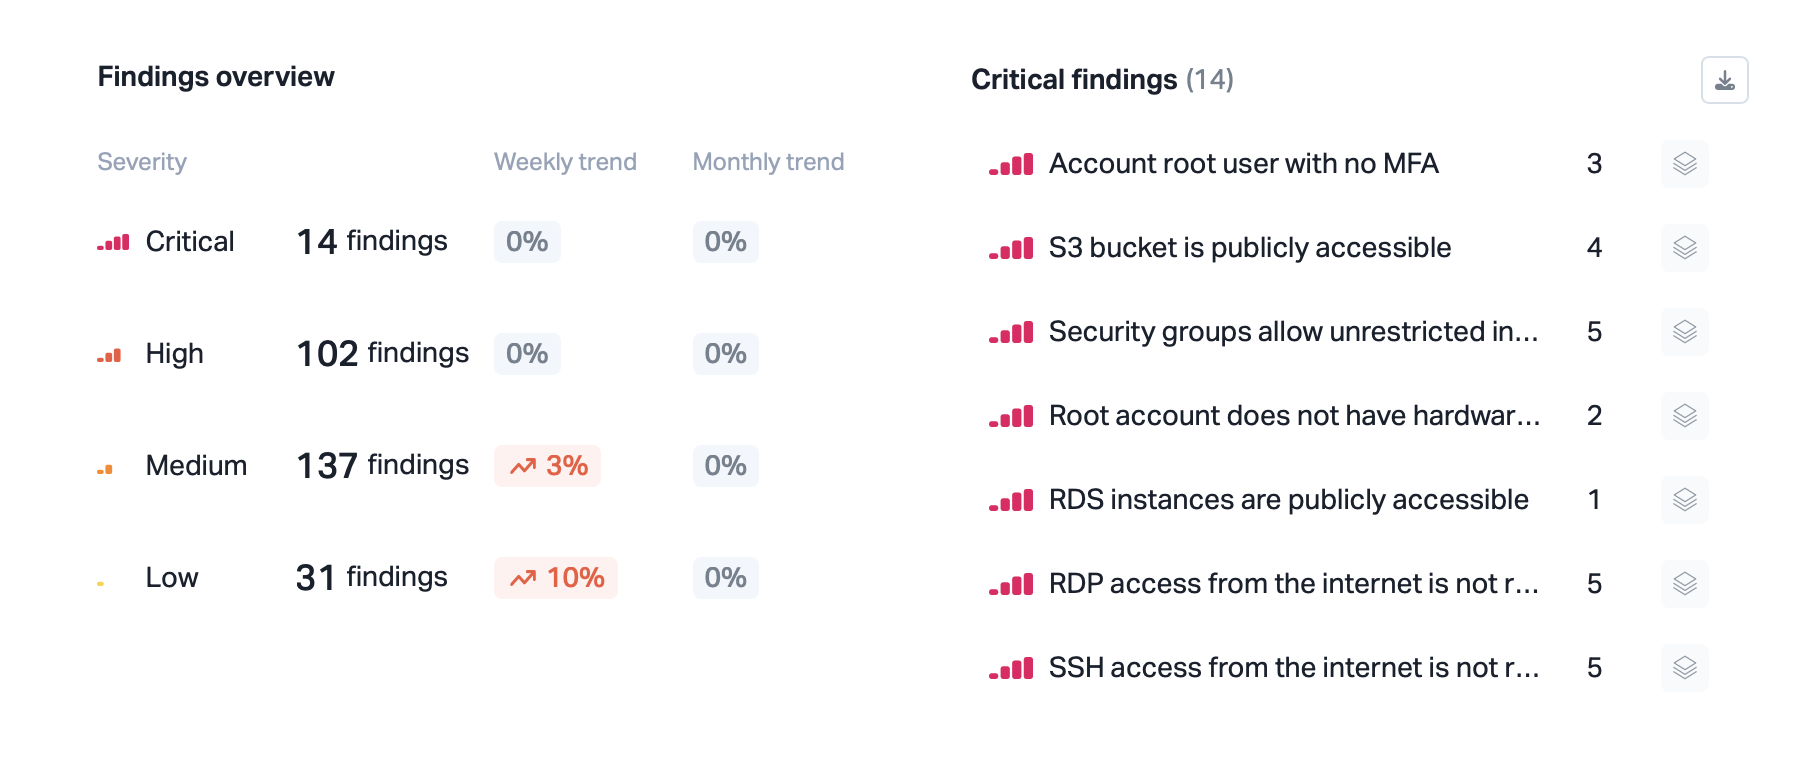
Critical Signals, Front and Center
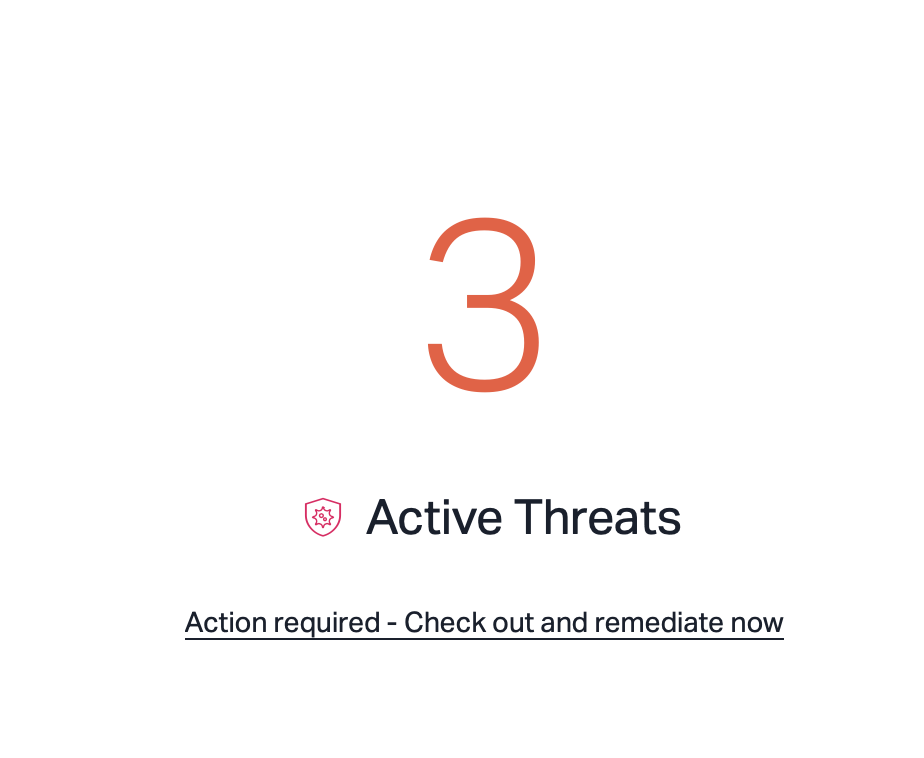
Some risks are always top priority, like publicly exposed assets, critical vulnerabilities under active exploit, or misconfigurations that enable lateral movement. That’s why we’ve elevated Active Threats into a persistent, high-visibility component of the home dashboard. Whether it’s a publicly exposed resource, a misconfigured policy, or a critical runtime threat, you don’t have to hunt for it. It’s already surfaced.
The Active Threats panel, in particular, is designed for speed. With one-click access to investigation and remediation, teams can cut response time and ensure that nothing urgent falls through the cracks.
Trends That Drive Accountability
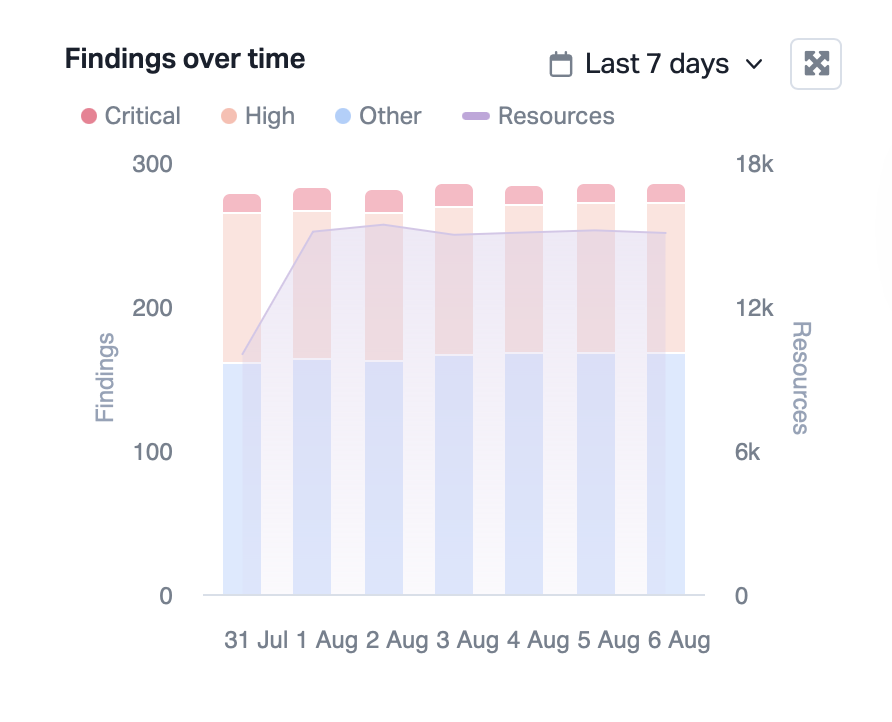
The Findings Over Time view helps teams correlate risk trends with real-world events like infrastructure changes, policy updates, and deployment cycles. By layering severity and resource count over time, it becomes easier to assess whether your environment is becoming safer or not. For example, if you recently rolled out a new set of IAM policies or deprecated a set of exposed services, you can immediately see if the trend line reflects reduced risk or if unintended issues have crept in. This panel turns the Upwind Home Dashboard into a feedback loop, giving teams the visibility they need to measure progress, demonstrate outcomes, and adjust course where needed.
From Noise to Signal: The Power of Runtime Context
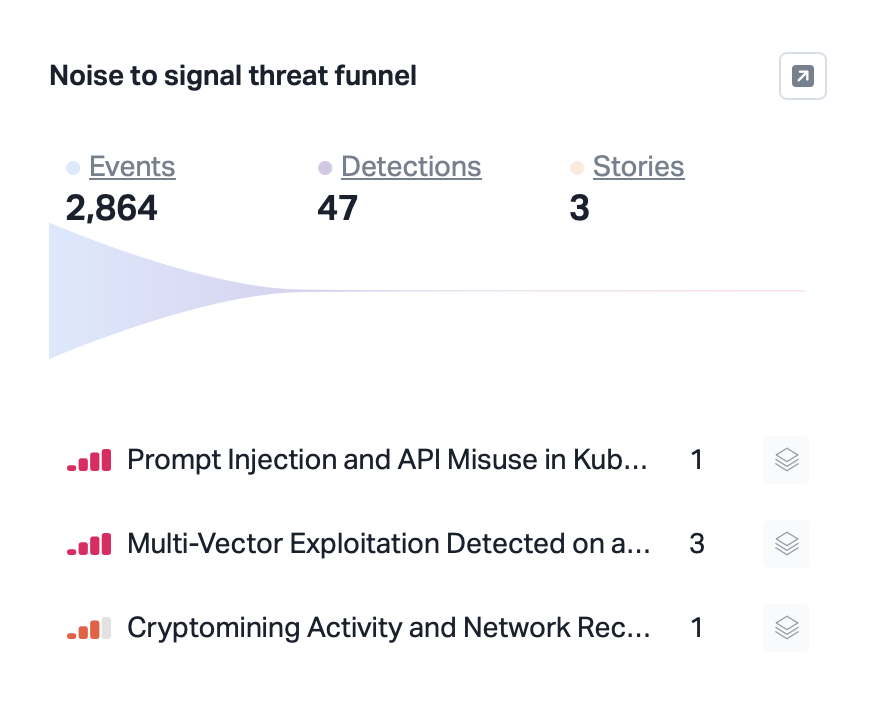
The Threat Funnel may be the clearest embodiment of our philosophy of simplicity. Here, you can see how thousands of raw events get distilled into just a handful of validated detections and confirmed threat stories. This signal compression is powered by Upwind’s deep runtime context, understanding what’s executing, how it behaves, and what it’s connected to in production. By rooting detection in real application behavior, we eliminate alert fatigue and surface only what matters.
This reduction is also about building trust. When an alert shows up as a story, teams can have high confidence that it reflects meaningful behavior, not hypothetical risk. It’s how we help security teams cut through the noise and zero in on validated threats, reducing time spent chasing false positives and enabling faster, more confident remediation.
Behavioral Threat Trends: Signals That Mean Something
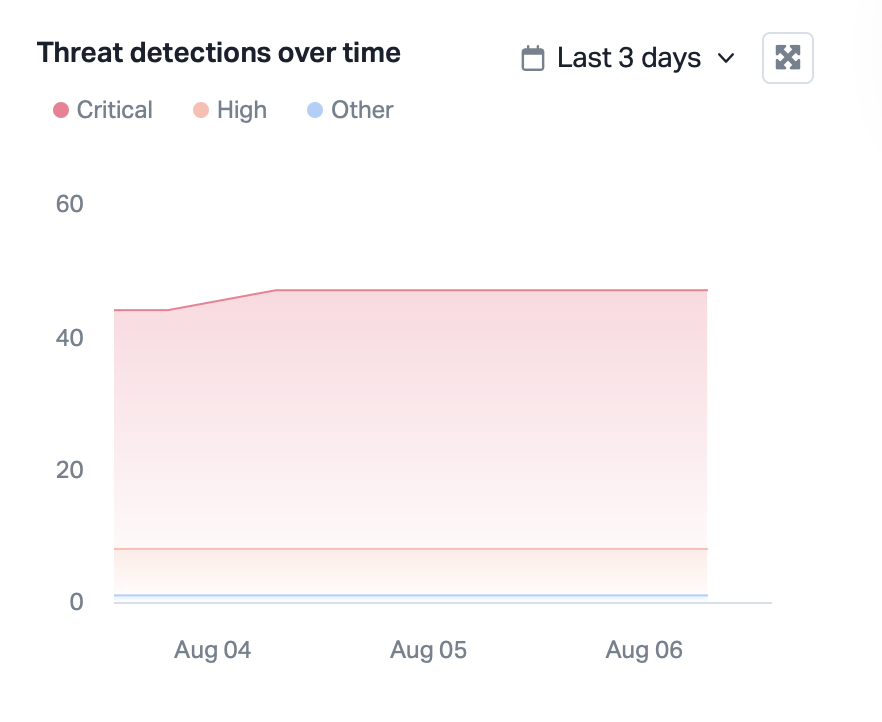
The Threat Detections Over Time panel extends Upwind’s runtime clarity across time. For example, a spike in detections following a new deployment may help teams identify unsafe service behavior or unexpected exposure that wasn’t caught in testing. Or a sudden drop in detections might reflect a service being deprecated or isolated.
By showing how validated threats shift day-by-day and breaking them down by severity, teams can connect behavior to events. With runtime context at the core, the answers to those questions are grounded in reality.
Threat Intelligence that Fits
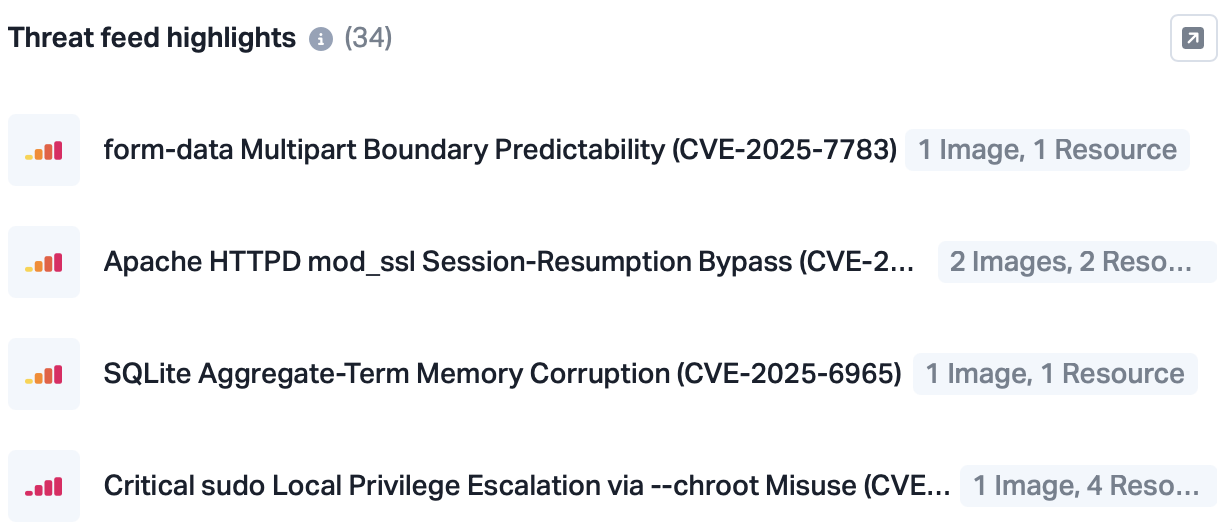
Being reactive isn’t enough anymore because the threats evolve faster than traditional playbooks can keep up. The Threat Feed Highlights section is a curated view of Upwind’s full threat feed, purpose-built to keep security teams ahead of the curve. It surfaces the most relevant CVEs, attacker behaviors, and exposure trends that may impact your specific environment. Each entry is enriched with contextual metadata, such as affected images, cloud resources, and runtime attributes, so teams can quickly assess exposure and respond without guesswork.
By distilling the broader threat landscape into actionable highlights, this panel bridges the gap between global threat intelligence and the specific risks inside your infrastructure. It helps teams stay informed, not overwhelmed, and ensures that threat awareness translates directly into preparedness.
AI Overview: Actionable Intelligence, Grounded in Runtime
As AI workloads become more common in production environments, securing them requires a fundamentally different approach. Traditional scanning tools, which rely on static analysis or configuration checks, fall short because they lack visibility into how AI services actually behave once deployed. Runtime visibility is essential for identifying dynamic risks unique to these systems – like exposed API definitions, anomalous session activity, or sensitive data flowing through unexpected paths. These threats often emerge not from misconfiguration, but from how services interact under real-world conditions. For example, an exposed LLM endpoint that generates responses based on unintended inputs, or a runtime privilege escalation path that only appears during certain workflow executions.
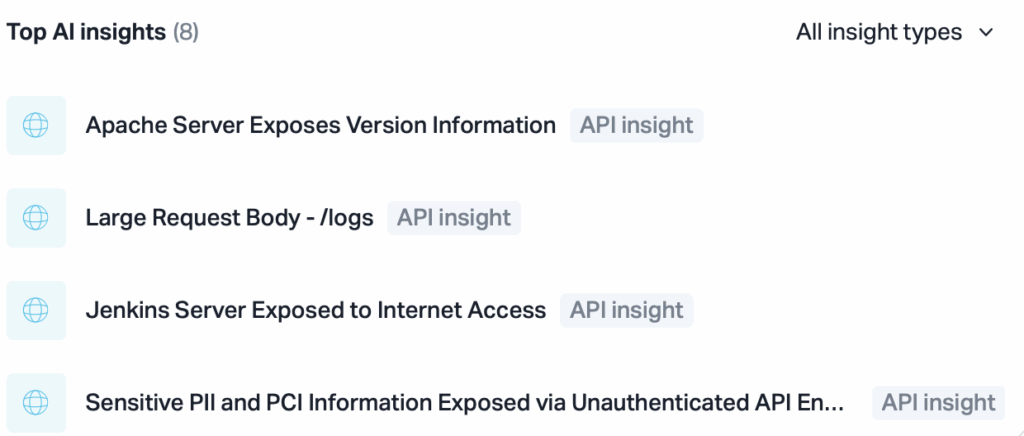
Our Top AI Insights view integrates with our GenAI Dashboard and addresses this challenge by observing and surfacing the most important runtime-based insights in production. It enables security teams to detect issues that static tools miss, providing continuous, contextual insight into the actual execution of AI-powered workloads.
Clarity in Motion: A Dashboard That Evolves With You
Every enhancement to our Home Dashboard is shaped by a simple goal: help users take action faster, with greater confidence. Whether you’re reporting progress to leadership, chasing down a new threat, or simply starting your day – our dashboard now meets you with signal, not noise. This isn’t a redesign driven by frustration, but a deliberate step forward in our journey to deliver security tools that adapt to the complexity of modern infrastructure.
Simplicity, prioritization, and runtime context continue to guide our design choices. Together, they create a dashboard that turns cloud risk into clear signals and gives teams the context they need to respond effectively.
Learn More
As your environment evolves, so do we – and we’ll keep refining the first mile of your security experience to be the one that matters most. Want to see it in action? Schedule a live demo with us or reach out at [email protected]