Top Ways Upwind Gives DevOps Engineers Network & Infrastructure Visibility

This is part one of a two-part blog series on how Upwind helps DevOps teams. You can read part 2 here.
Upwind’s Cloud Security Platform provides customers with end-to-end visibility into their environment – continually performing DevOps-grade deep assessments of your infrastructure & configuration, discovering everything you run and keeping this inventory up-to-date.
We systemically correlate this information with a detailed history of your continuous integration & deployment (CI/CD) events, along with build-time data. This is then paired with runtime intelligence that includes context from Layers 3, 4, and 7, DNS, APIs, and process-level insights.
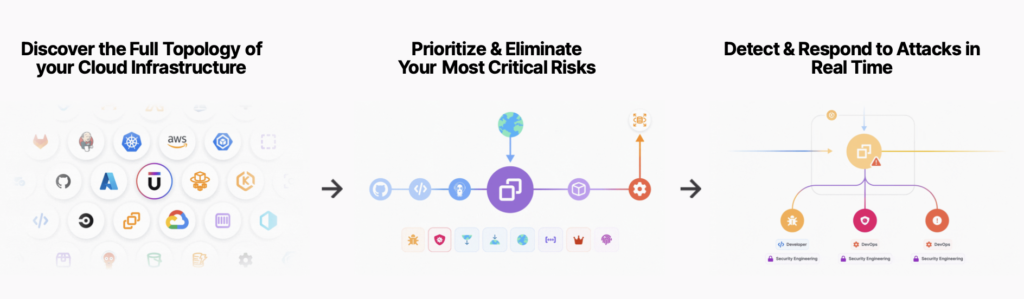
The Upwind Security Platform enables the new operating model of cloud security, with powerful, instant visibility alongside deep, efficient, integrated protection across containers, serverless, PaaS and classic VM-based environments.
In doing so, we also address the evolving need for security to touch every area of an organization – including DevOps teams. Below, we will examine ways that DevOps teams can use Upwind to streamline their workflows, quickly access real-time information about their cloud environments and ensure the security of their deployments.
1. View Network Topology on a Graph-Based Timeline
Upwind’s topology map sits on a graph-based timeline, allowing you to easily view network changes over time, go back in time to investigate events and quickly investigate difs.
The topology map is updated in real-time with data from Upwind’s eBPF sensor, which allows you to save time and automatically identify what you are running, how it is communicating and alert if there are any unexpected or anomalous communications pathways. In addition, the map also allows you to focus on specific areas of cloud architecture using filters, such as zeroing in on specific databases or applications and focusing only on traffic and architecture that apply to a specific use case.

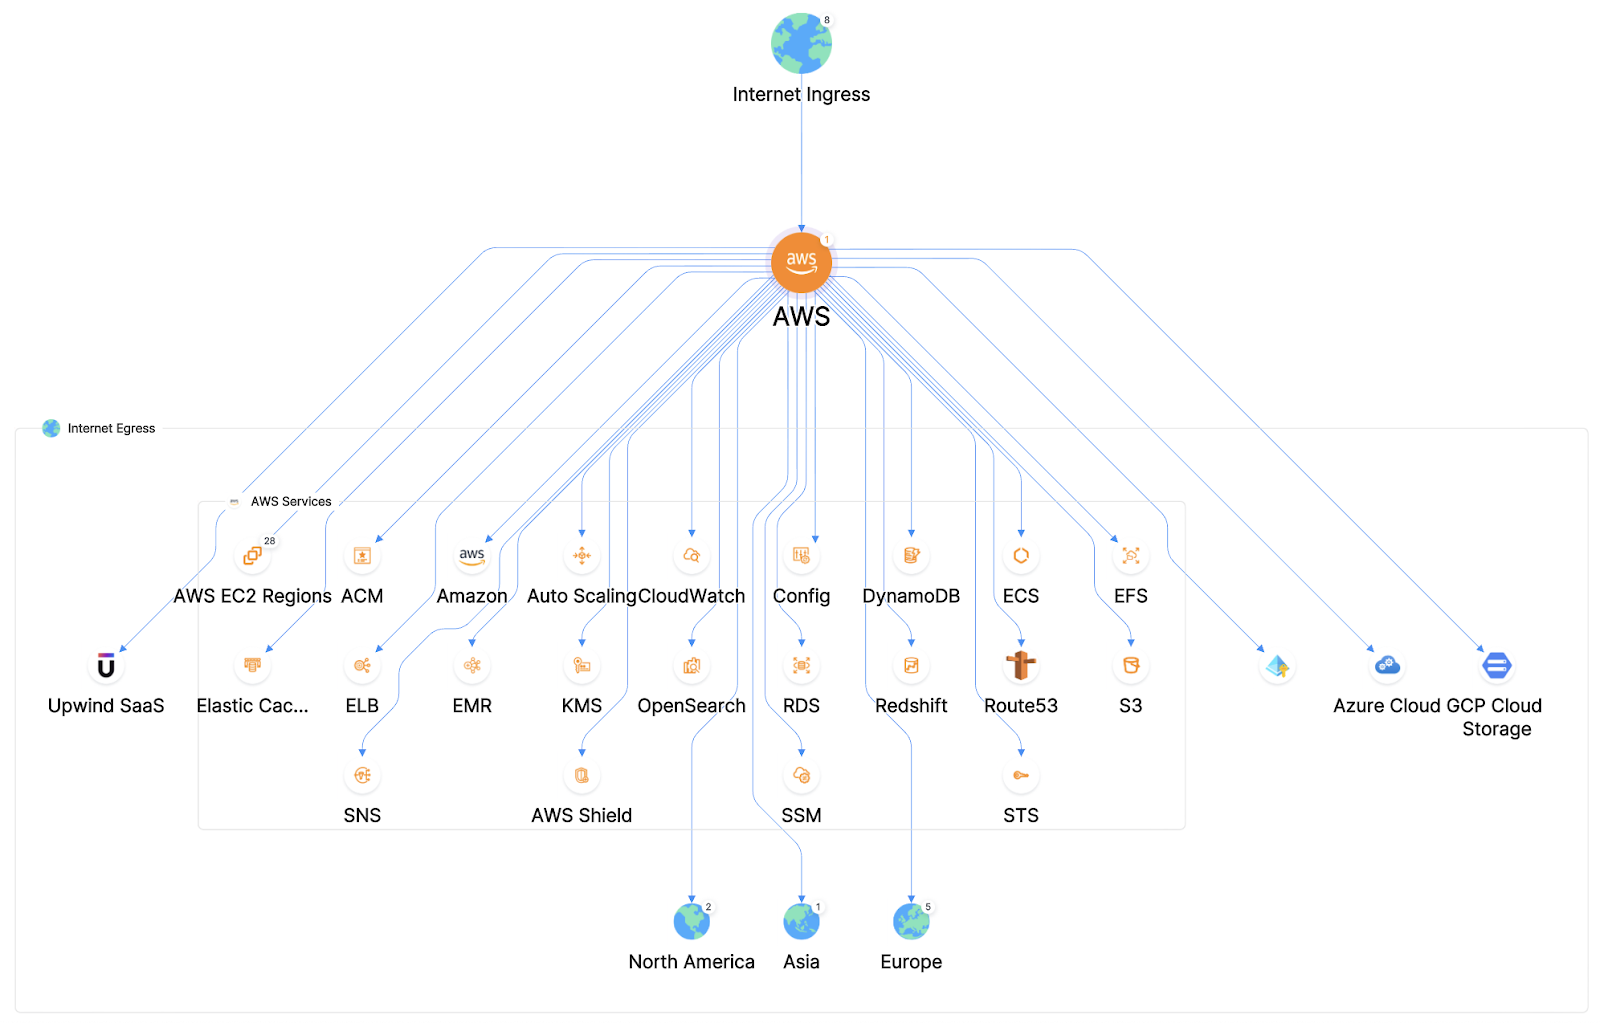
2. Monitor Resource Communication with Full Service Topology Map Service
Upwind shows real-time communication between infrastructure and applications across all clouds and services and the connections between them, as well as providing a real-time system diagram of your infrastructure in a simple, easy-to-digest way. This includes a real-time view of all of your resources and how they talk in real-time and over time with cloud services, PaaS and the Internet.
In addition to viewing network traffic, you can also view Internet ingress and egress in real-time, as well as identifying any resources in your cloud environment that are speaking to the Internet.
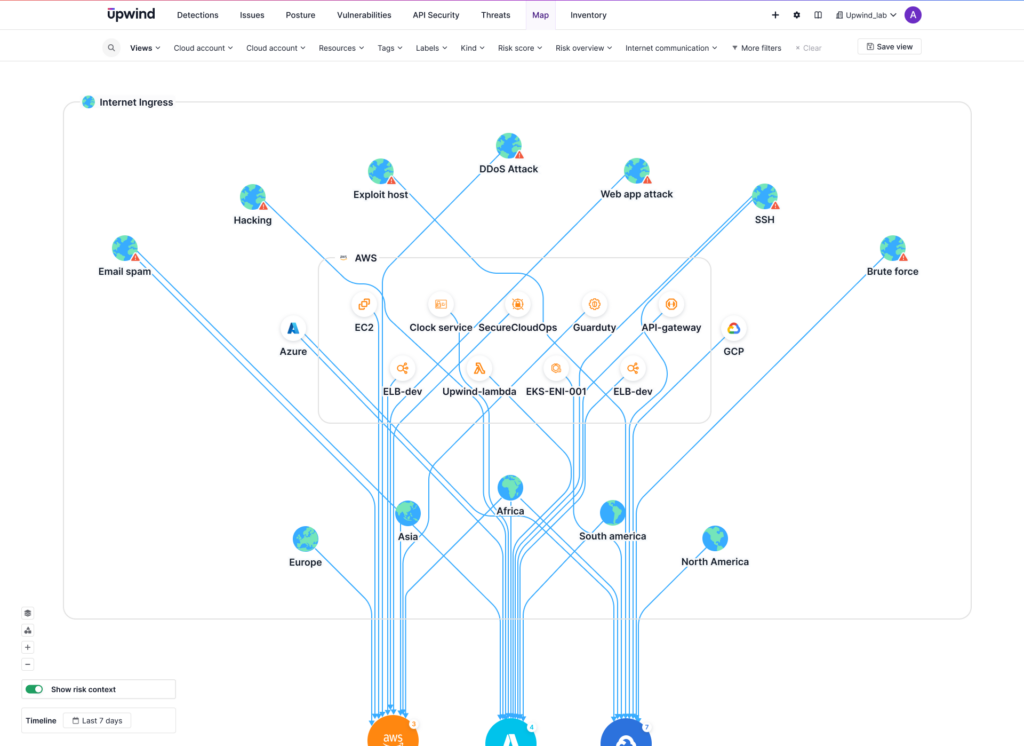
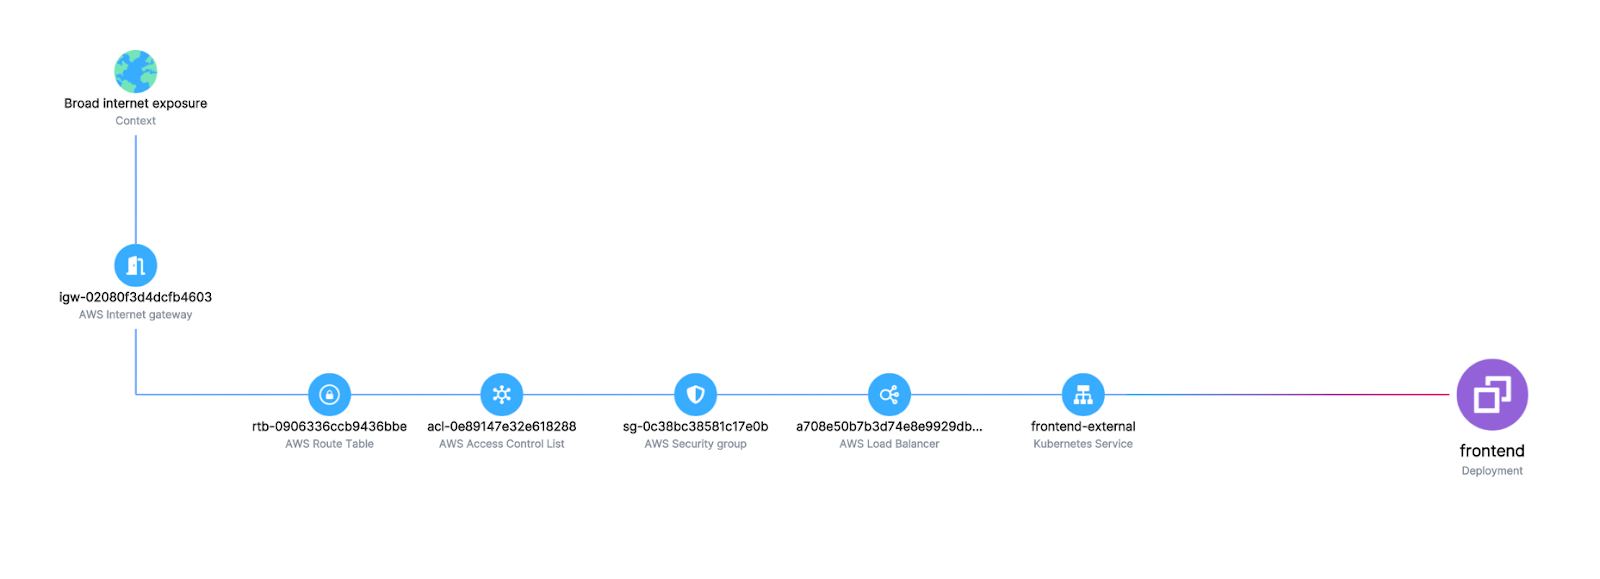
Upwind shows the entire path of Internet exposure, including services, load balances, security groups, access control lists, route tables, internet gateways and the IP communication to the internet. This makes it easy to immediately identify any misconfigurations that are unintentionally allowing resource communication to or from the Internet, such as a misconfigured security group, or overly broad access permissions.
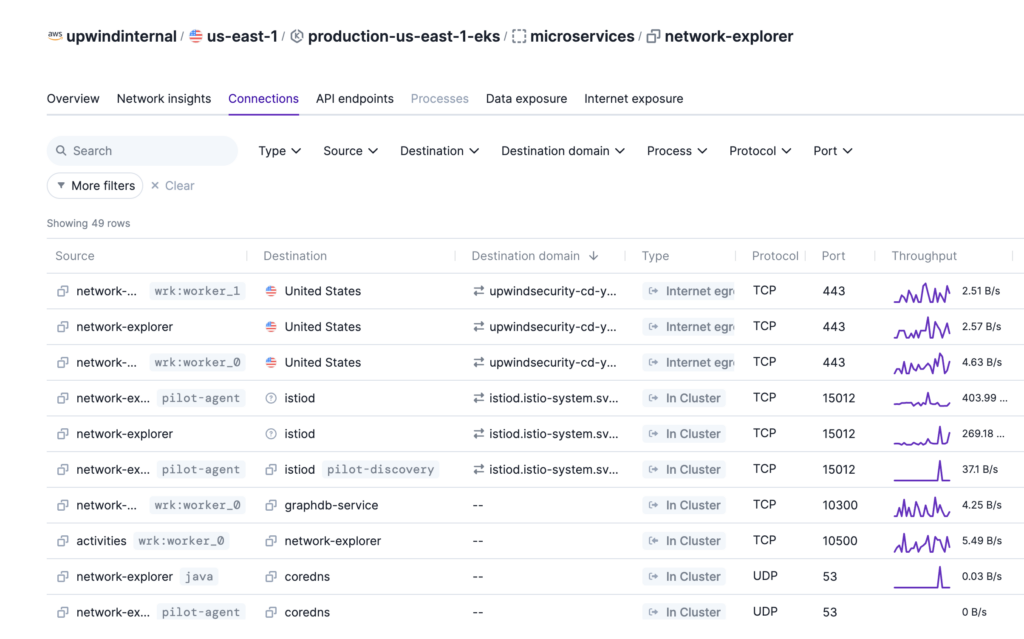
3. Establish Network Baselines & View Traffic by Source Process, Port, Protocol and Type
Not only does the Upwind Platform show you overall network topology, it also immediately identifies changes in network traffic, breaking down real-time network traffic by source, destination and destination domain, and showing traffic by process, port, protocol and throughput. This makes it easy to analyze traffic patterns, identify unusual traffic and monitor application and resource performance.
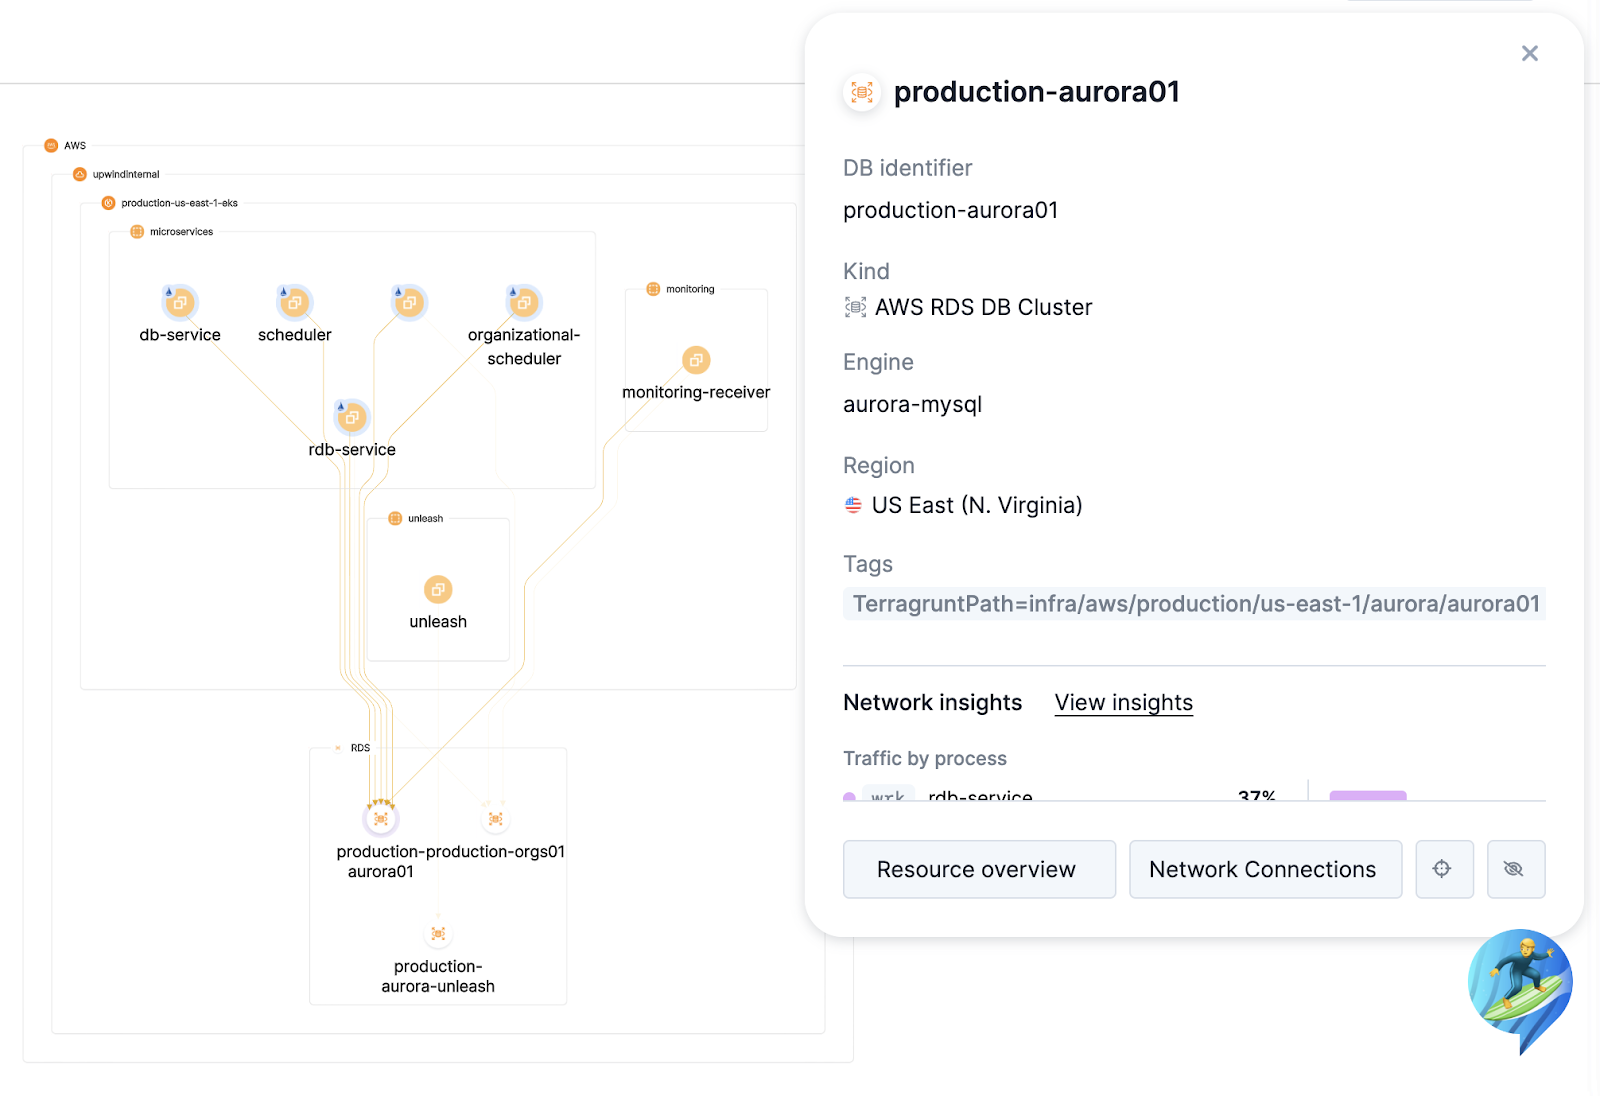
4. View PaaS & Self-Managed Database Connections
Upwind’s runtime insights show you in real-time how resources interact with specific databases like RDS, Elasticache, Kafka, GraphDB, allowing you to see the exact database instances with end-to-end topology. Using the topology map, you can drill down into the specific databases your assets communicate with and receive rich PaaS visualization and context.
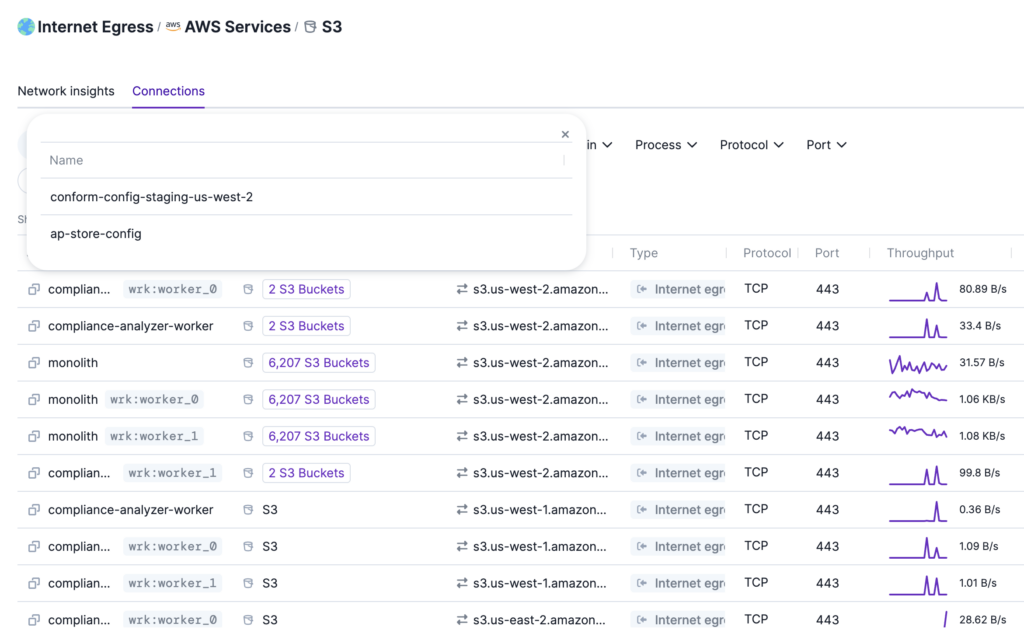
5. Gain Multi-Cloud Object Storage Visibility
While many organizations use observability or visibility tools, they typically show traffic only within a specific cloud.
Upwind provides the ability to view which resources are accessing object storage such as S3 buckets, Google Cloud Storage and Azure Storage, as well as viewing a complete list of all storage across clouds via easy to-query graph database.
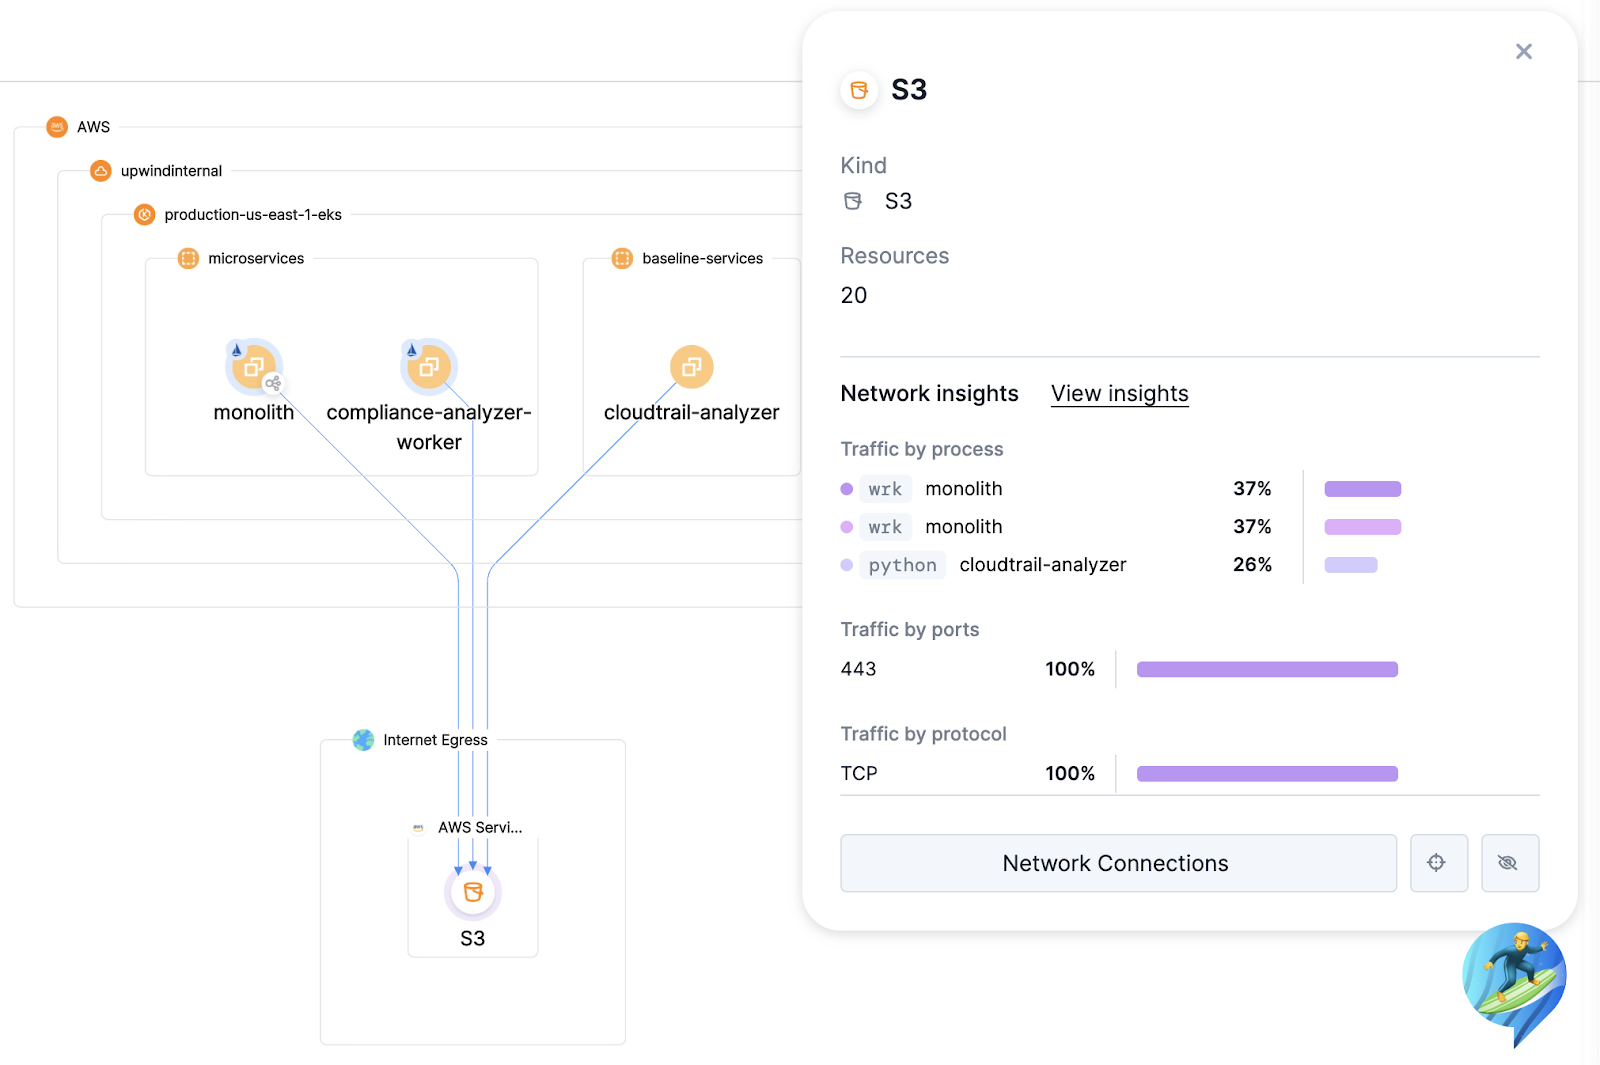
This allows you to easily discover any type of storage in your cloud and track important parameters such as location and encryption, risks and possible threats. You can also view any attached compute resources and easily understand the impact of encryption on your resource usage.
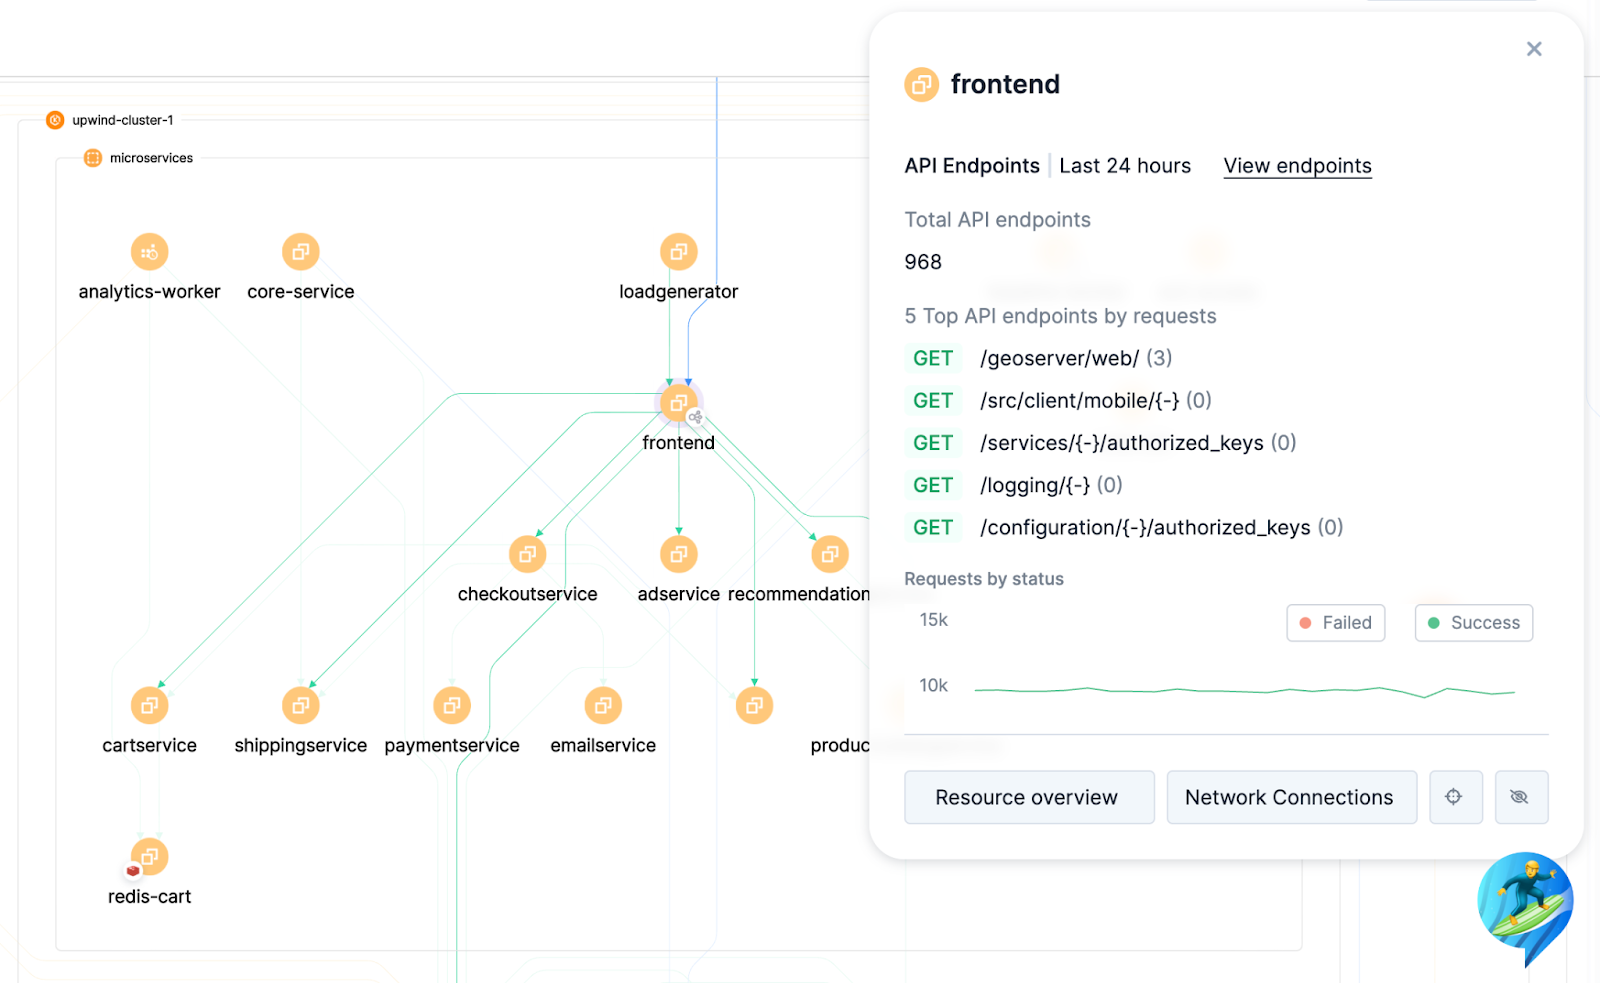
6. Automatically Discover & Catalog API Endpoints
Upwind gives you layer 7 visibility, automatically discovering your full API catalog and HTTP endpoints. This gives you real-time insights into which endpoints are being exposed by workloads, as well as insights into any associated workload or API vulnerabilities.
7. Control Third-Party Communication and Data Flows
Upwind gives you the ability to see which third-party services you are communicating with, as well as view if that communication is happening within your account (e.g. within an AWS account), or externally to the Internet, including mapping your applications, and whether they are accessing cloud provider services such as Amazon EMR, Amazon SQS and Google Cloud SQL over known public IP ranges.
This helps you to easily understand the destination of egress traffic, monitor third-party service usage and control data flows.
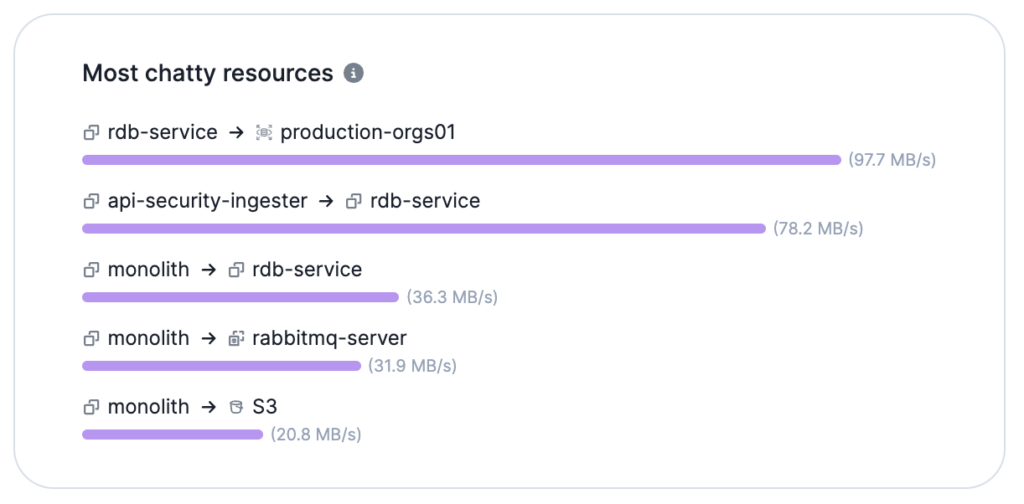
8. Find Heavy Network Costs
Upwind’s ability to view real-time network traffic not only protects your cloud infrastructure, it also gives you the ability to perform network cost analysis. Within the topology map, Upwind provides precise insights into your network traffic out-of-the-box, allowing you to pinpoint the most “chatty” resources within your environment and evaluate network consumption.
By doing so, Upwind gives you insights into cost optimization, such as how to optimize cross-AZ (availability zone) network traffic or how to optimize NAT gateway usage and reduce infrastructure costs.
9. View Full Kubernetes Topology
Upwind’s eBPF-based sensor immediately lets you see your entire Kubernetes topology across clusters, namespaces and workloads, as well as their associated Internet exposure and actual ingress paths.
Upwind does this by showing real-time K8s network traffic and mapping your end-to-end service topology with graph-based network and process-level topology of your containers’ infrastructure.
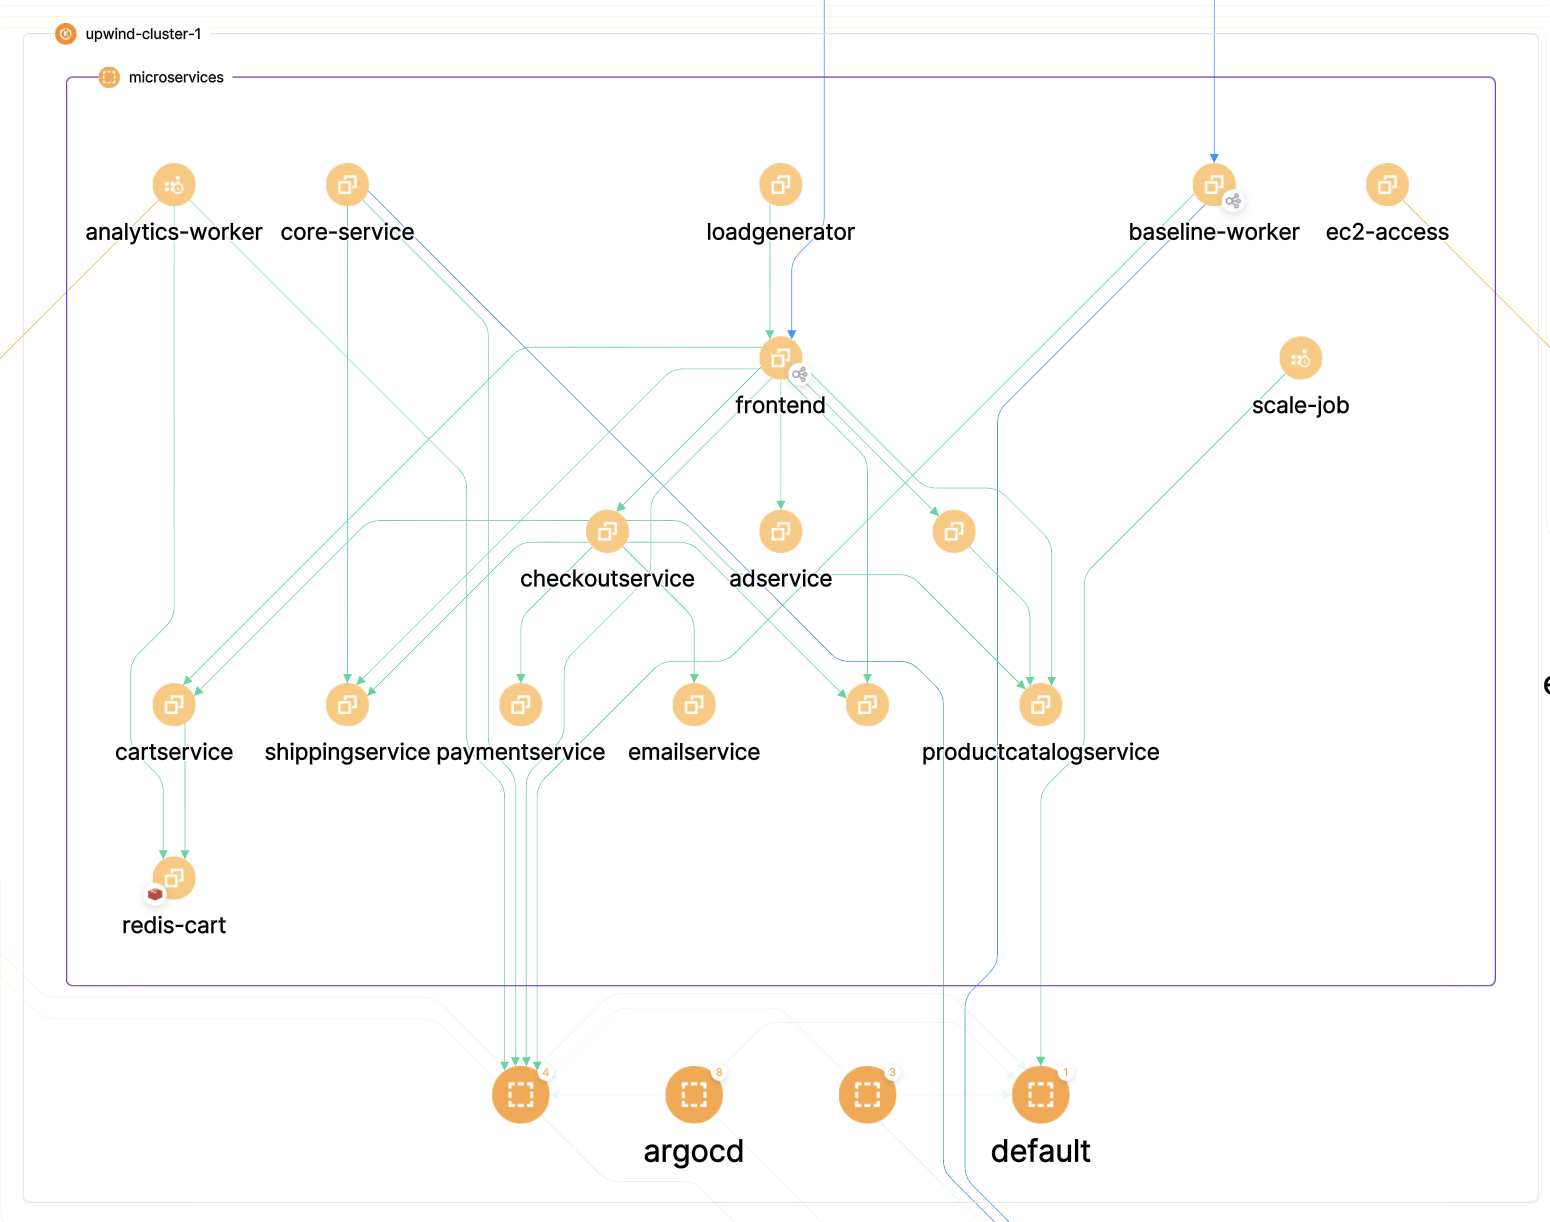
You can dive into your k8s network communication by leveraging the network protocol (Layer 3), the IP addresses (Layer 4), APIs, and DNSs (Layer 7) to resolve the internal IP addresses and AWS ENIs (Elastic Network Interfaces) information to their respective AWS services, such as Amazon RDS, AWS Lambda, SQS, SES, Elasticache, DynamoDB, the actual S3 buckets, API gateways and more. Upwind also combines DNS and API endpoint data with process-level visibility to show where requests came from and which AWS native service is involved in the path.
This provides accurate, end-to-end visibility of rapidly evolving k8 environments, with an increasing number of PaaS and IaaS components & neighbors every day.
10. Upwind Inventory: See the Full Landscape of Your Cloud Resources
Upwind performs a deep discovery of your running infrastructure and applications, helping you to easily understand which services and resources are currently in your cloud estate, including VMs, containers, storage, PaaS, identities and APIs.
This visibility makes it easy to see and understand the entirety of your running infrastructure and applications.

In addition to viewing your current cloud assets, you can also see the state of networking and links within your infrastructure, such as viewing links inside Kubernetes clusters and VMs. This allows you to have greater control over your deployments and their behaviors at runtime, as well as viewing cloud infrastructure and applications across multiple cloud providers in one centralized location.
Each and every screen on Upwind can be filtered out by labels, tags and annotation. That gives you an easy way to save views and dashboards that provide every development team exactly what they need to manage their applications, without sifting through mountains of information that’s irrelevant to them.
Learn More
Upwind’s real-time analysis of network traffic and resource communication, deep root cause context and risk prioritization are powerful capabilities that enable DevOps teams to quickly and effectively deploy resources while enhancing performance and security. This in turn reduces friction between DevOps and Security teams, allowing the entire organization to work collaboratively, remain focused and agile.
For more information about how Upwind helps DevOps teams or to see a demo, reach out to [email protected].