
The Upwind Platform is a hybrid solution, enabling a best of both worlds approach with agentless deployment options for rapid time-to-value and a sensor for industry-leading realtime and runtime security. While we’ve previously covered our agentless cloud sensors, this post focuses on how quickly you can deploy the Upwind sensor and gain deep, real-time visibility into your infrastructure and applications.
“Within minutes of deployment we had real-time protection of our entire infrastructure. The entire process using Upwind was incredibly simple.” – Alon Reznik, Chief Architect, Rivery
What is the Upwind Sensor?
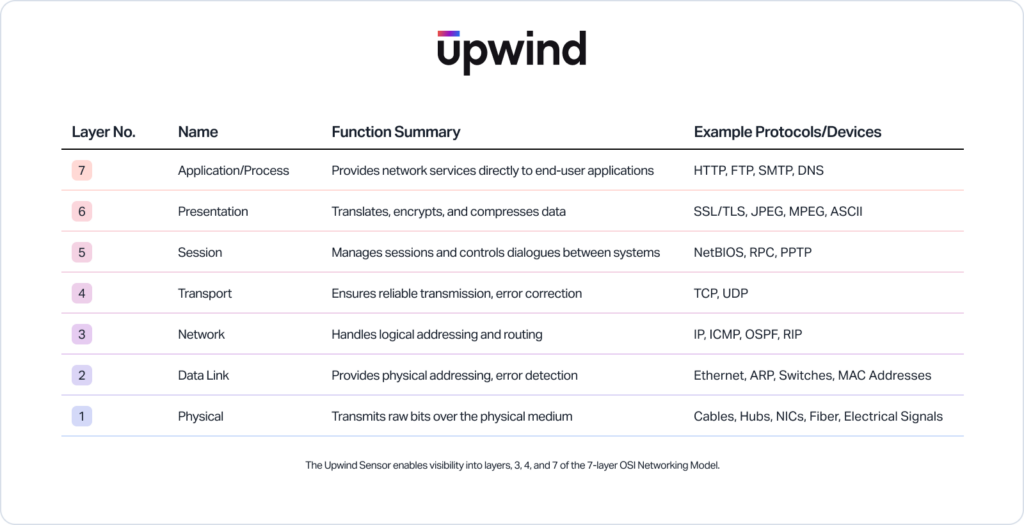
The Upwind sensor is lightweight, high performance, easy to deploy, and simple to operate. It provides real-time and runtime visibility into system calls, process executions, file access, and networking traffic at layers 3, 4, and 7 of the OSI model.
Powered by eBPF, the sensor is engineered for efficiency. It uses less than 1% CPU and under 1 GB of RAM, even when scanning large container images. For example: at h2O.ai, it successfully scanned a 30GB container image using just ~3% of the image size in memory.
The Upwind Sensor enables granular, process-level insight into containers and VMs – without adding operational drag.
The Upwind Sensor is also secure, requiring mutual, certificate-based authentication to connect to the Upwind Console. The Upwind Sensor’s capabilities are limited to getting policies from Upwind Console and sending event data to the Upwind Console. The Upwind Sensor has no ability to interact with Upwind Console beyond the websocket – a design choice that enhances security and minimizes blast radius risk.
How to Install the Upwind Sensor
When we built the Upwind Platform, we understood the need to make it easy to install. Exact deployment steps vary slightly, depending on environment – you can read about your specific scenario in our documentation here. For this guide, we’ll walk through deploying the Upwind Sensor in a Kubernetes cluster using a Helm operator.
Step 1. Generate Credentials
Only needed if you want to create new client credentials. If you already have client credentials, you can skip this step.
Select the + (plus) symbol at the top of the screen and select “Connect Kubernetes Cluster.” Select “Generate a new one” to create a new client ID and client secret. Provide a name and select “Generate”. Alternatively, you can generate credentials in the Credentials page in the console. For more information, review the documentation on Credentials.
After you have generated credentials, they will automatically be copied into step three and inserted into the UPWIND_CLIENT_ID and UPWIND_CLIENT_SECRET fields.
Step 2. Add Upwind Helm Repository
To add Upwind to the Helm repository, execute:
helm repo add upwind https://charts.upwind.io/ && helm repo updateStep 3. Deploy Upwind Operator
With the Upwind Helm repository added, you can now deploy Upwind to your cluster. If you are re-using a credential be sure to add it into the UPWIND_CLIENT_ID & UPWIND_CLIENT_SECRET fields.
To install the helm chart, execute the install command as follows:
For containerd:
helm install upwind-operator upwind/upwind-operator
    --namespace upwind
    --set credentials.clientId="${UPWIND_CLIENT_ID}"
    --set credentials.clientSecret="${UPWIND_CLIENT_SECRET}"
    --create-namespace
For CRI-O:
helm install upwind-operator upwind/upwind-operator
   --namespace upwind
   --set credentials.clientId="${UPWIND_CLIENT_ID}"
   --set credentials.clientSecret="${UPWIND_CLIENT_SECRET}"
   --set agent.values.containerd.enabled=false
   --set agent.values.crio.enabled=true
   --create-namespace
Step 4. Test Connectivity
It is recommended to validate that none of the resources deployed by Upwind are in a Pending/Failed or any other error state, which will prevent the Upwind sensor from operating as expected.
Run the following command to validate that all the resources are in a Running state:
kubectl get agent,clusteragent --namespace upwindThat’s it. Your Upwind Sensor is now running and you’re collecting real-time signals and runtime context from your environment – all in under 5 minutes. For troubleshooting, see the troubleshooting pages corresponding to your deployment scenario in the Upwind documentation.
Learn More
Sensor deployment may differ slightly by environment, but the core idea remains: installation should take minutes, not hours. To prove our point, you can view the video of our sensor being deployed on an Amazon EC2 instance in 5 minutes in the video linked in this blog.
Get full-stack runtime visibility and protection, starting today. Schedule a demo, or drop us a line at [email protected] to find out how.