topology map
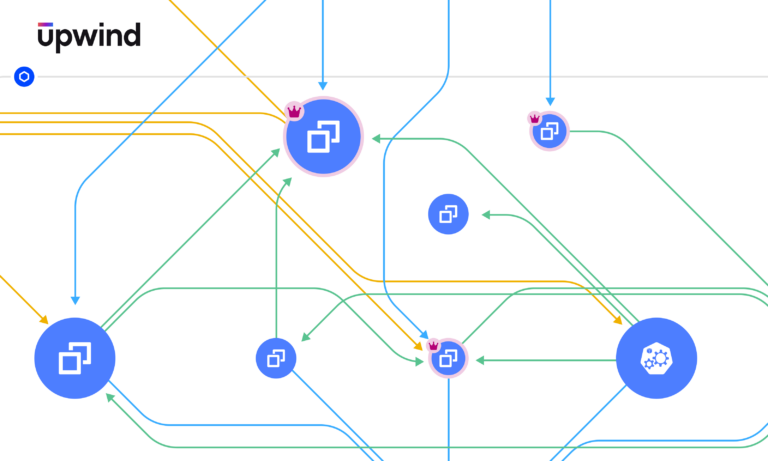
Automatically View High-Privilege Identity Insights in the Upwind Topology Map

We’re excited to introduce a powerful new capability in the Upwind Cloud Security Platform – enhancing security by providing seamless visibility into highly privileged identities for every containerized resource in your cloud environment. Now available directly in the Upwind Topology Map, this feature helps detect and mitigate excessive permissions, reducing the risk of privilege escalation…
Top Ways Upwind Helps DevOps Engineers Monitor APIs & CI/CD

This is part two of a two-part blog series on how Upwind helps DevOps teams. You can read part 1 here. The Upwind Cloud Security Platform helps organizations accelerate productivity and empower their Dev, Security, and DevOps teams to innovate within a secure and efficient environment. In our last article on how Upwind helps DevOps…

View API Endpoints and Layer 3, 4 & 7 Traffic on Upwind’s Topology Map
We are excited to announce a new capability that allows you to discover and view API endpoints on Upwind’s infrastructure topology map. We recently launched Upwind API Security, through which you can discover your API catalog, and identify API vulnerabilities and threats. This new capability expands this even further, allowing you to view API endpoints…
Filter Your Network Topology in Real Time
We are excited to announce a new capability - custom runtime topology map views. This allows you to view Upwind’s runtime topology map with predefined filters including riskiest resources and resources with active internet ingress. We will be constantly adding new out-of-the-box views, and you can also create your own custom views with any combination…

Understand Your Network Patterns with Throughput Over Time
We are excited to introduce a new metric, allowing you to get visibility into your incoming and outgoing throughput over time for the last 7 days. This new capability gives you even more network visibility and allows you to easily and quickly understand real-time network patterns and over-time patterns. This information can be viewed through…
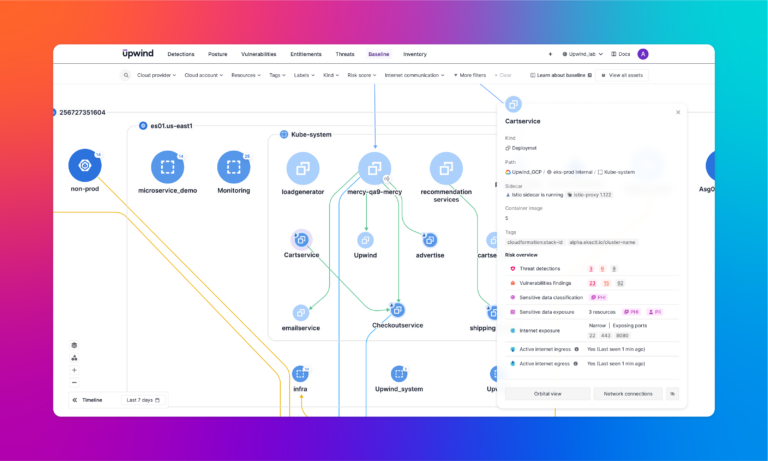
Runtime-based Risk Augmentation in Your Cloud Infrastructure Topology
We’re excited to announce a major capability in our runtime topology map that will now include risk overview context icons and new filter capabilities. Using these new capabilities, you can view each resource’s risk overview at a glance with built-in icons on the topology map. This allows you to rapidly filter and locate at-risk resources…

Leverage Runtime Data to Govern Kafka and ElastiCache Communication
We are excited to announce that Upwind has now added enrichment to managed streaming service Kafka and ElastiCache in our context-rich topology map. This new capability leverages runtime data, allowing you to govern your database network access through the Upwind platform. This builds on top of Upwind’s existing RDS cluster and Google Cloud SQL enrichment,…

Discover S3 Bucket Communication in Real Time
We are excited to announce that Upwind recently released a new capability - S3 bucket awareness. This new capability allows you to easily discover the specific S3 buckets that your assets are talking to in order to better understand attack paths, communication to sensitive data sources and distribution of assets. Using Upwind’s topology map, you…
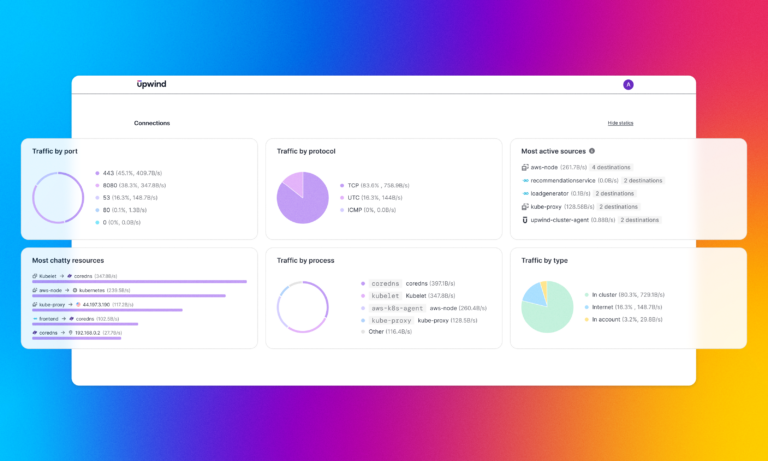
Get DevSecOps insights with Upwind’s Topology Map
We are excited to announce a new feature release - Upwind’s Connections Insights!This feature gives you supercharged, out of the box DevSecOps insights and makes it even easier to understand your resource communication at a glance, giving you high-level insights about important things that are happening in your network. Instead of diving into detailed reports,…
Identify Threats and Risks in an Istio-based Kubernetes Environment
We are excited to announce a new capability - Istio awareness. Istio allows organizations to secure, connect and monitor traffic to your microservices. Starting today, Upwind will identify Istio sidecars and proxies and use this information as context for our threat detection and risk prioritization engine. Upwind can now understand entire network flows, all the…
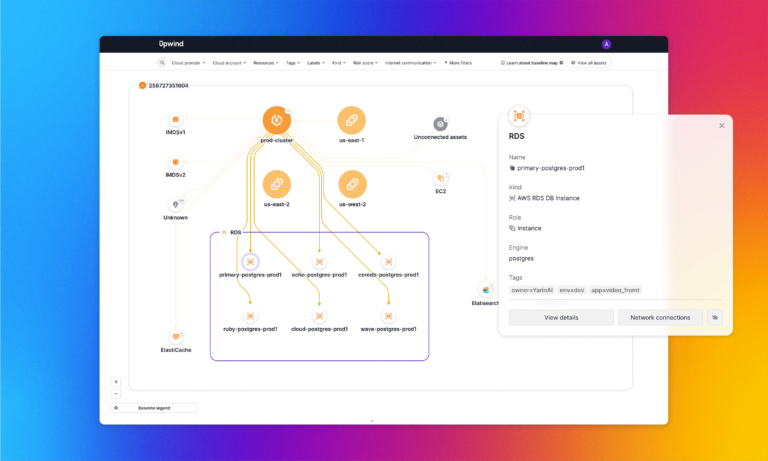
Leverage Runtime Data to Govern Your Database Network Access
We are excited to announce that Upwind has now added enrichment to RDS clusters and Google Cloud SQL in our context-rich topology map, leveraging runtime data to let you govern your database network access. The Upwind platform has always shown communication to RDS, but starting now, the map will drill down into the specific databases…