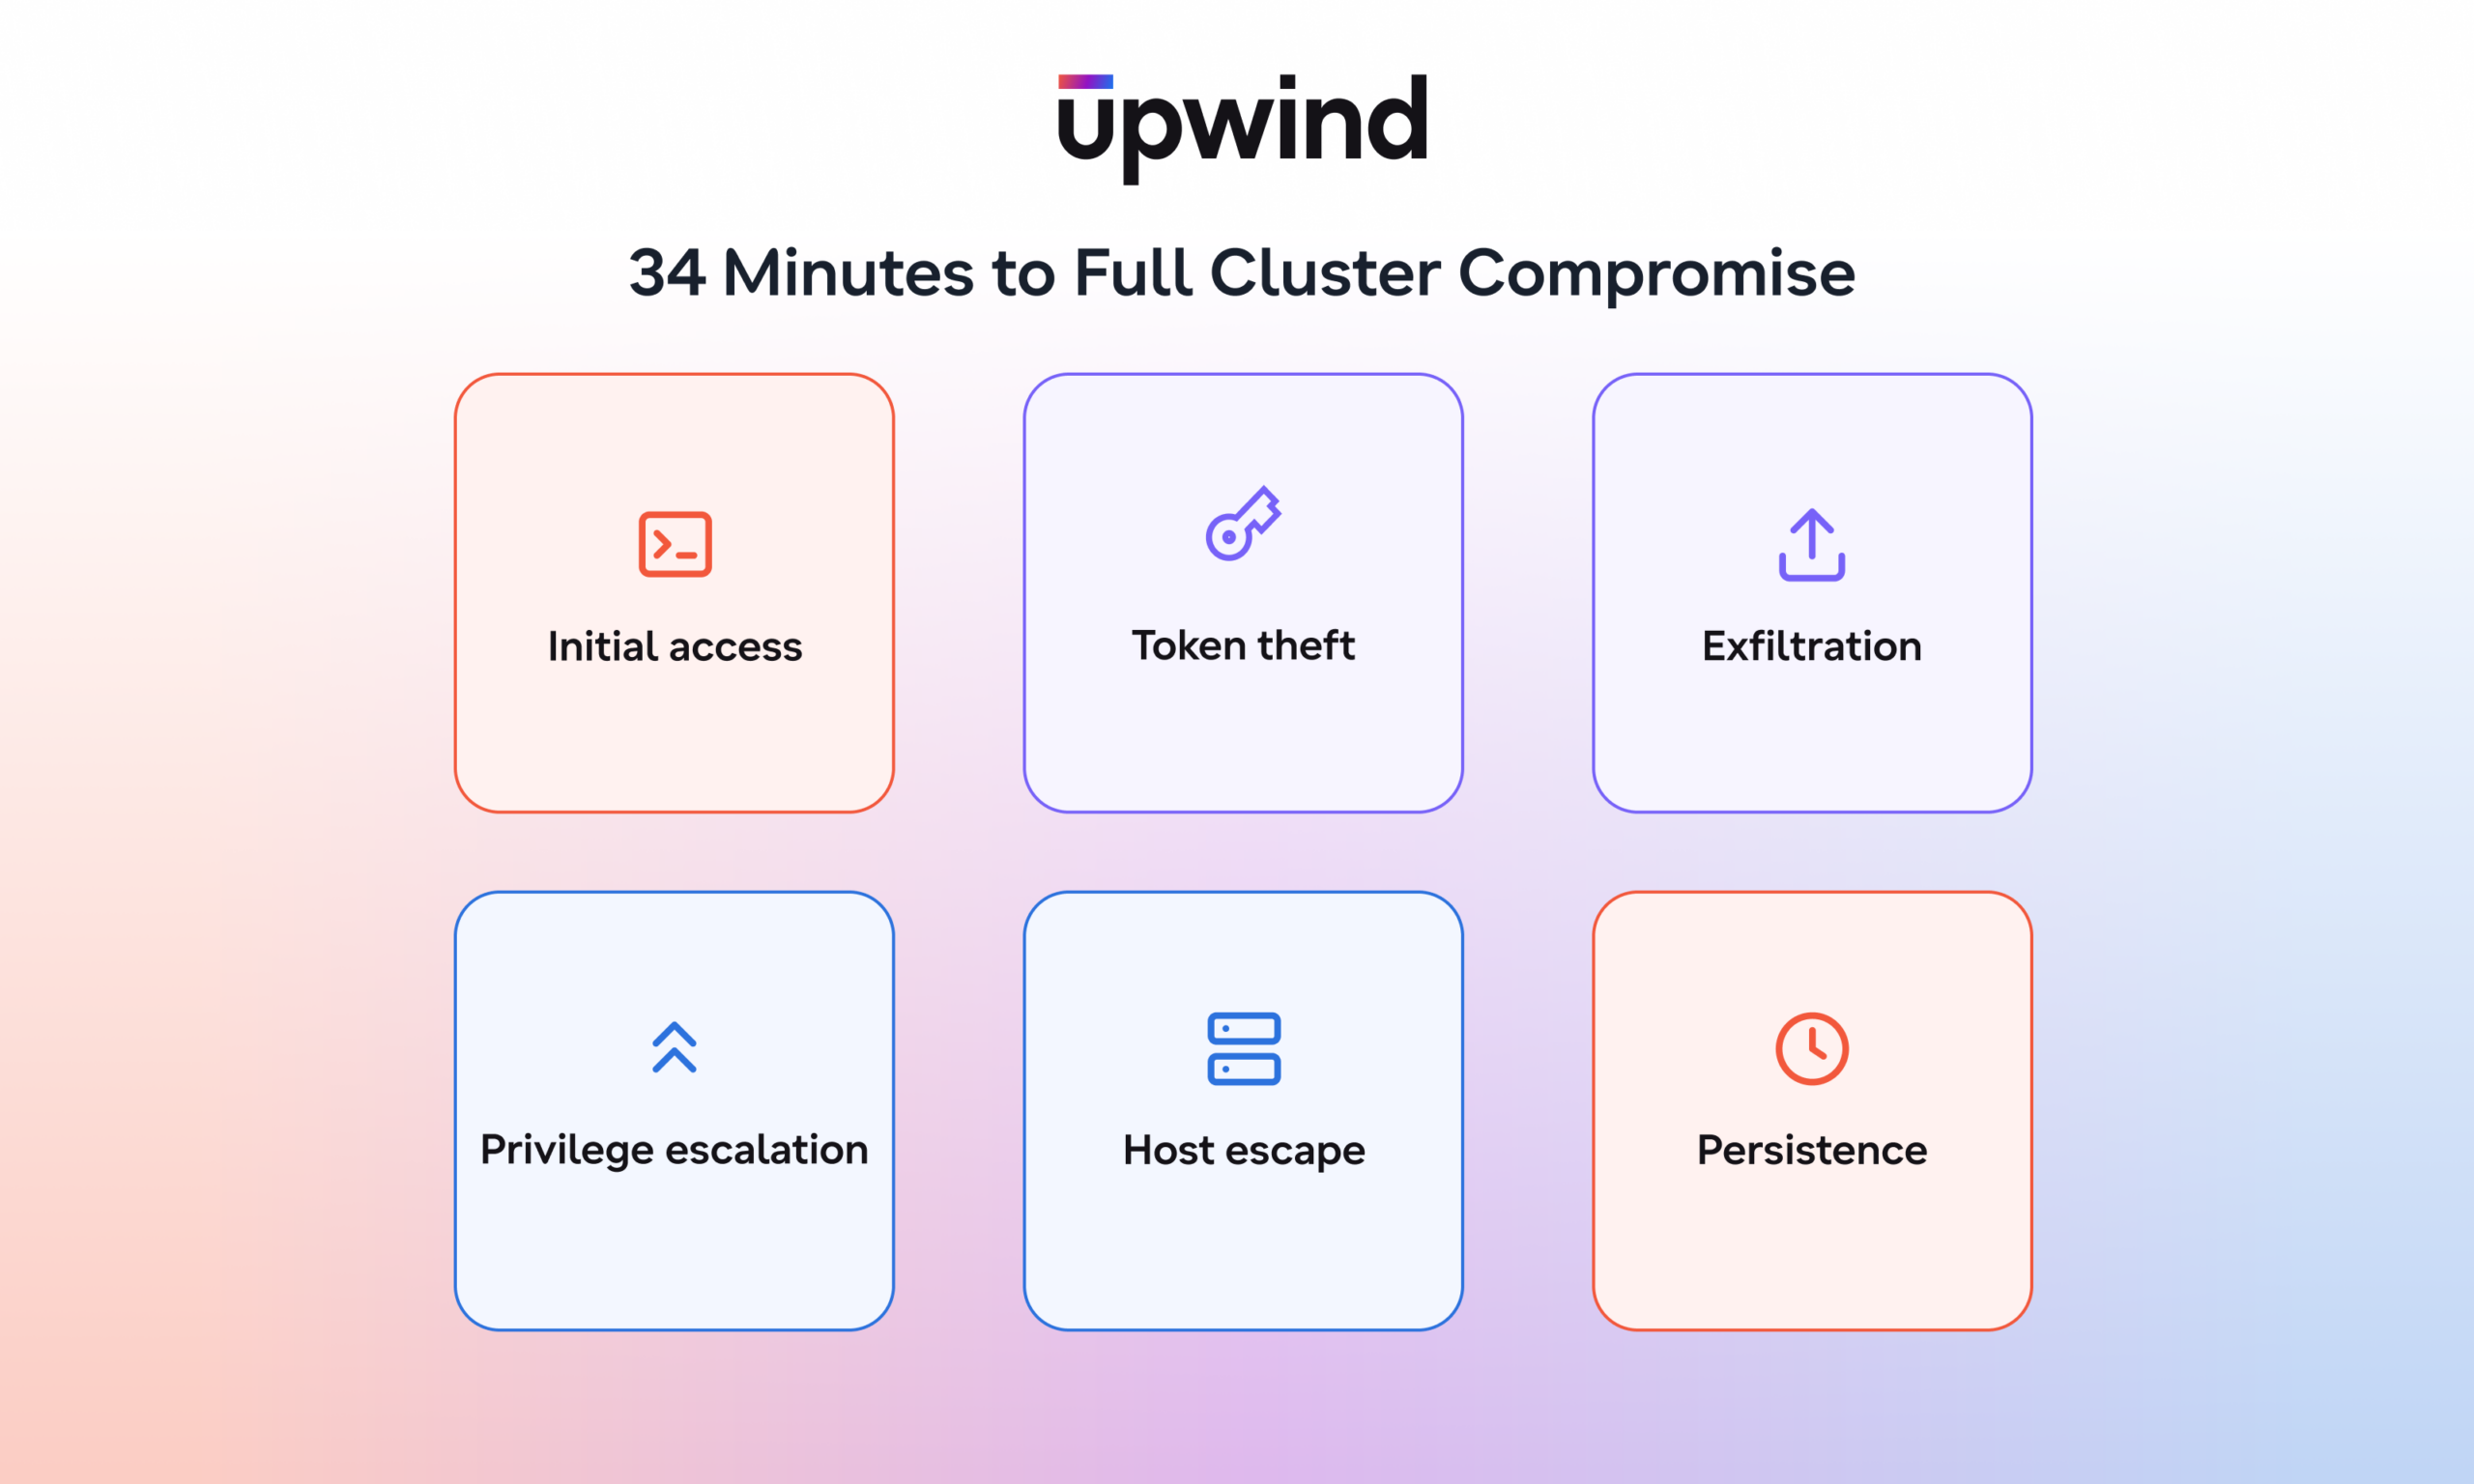

An attacker turned one HTTPS POST into a full compromise of a production EKS cluster in 34 minutes. We built Upwind Story Graph so that when an incident like this one lands on your team, you can see in one look how far the attacker got and what you need to shut first.
Here is how the attack unfolded
At 11:22:10 PM on September 18, a single HTTPS POST request was sent to /configs through a public ELB, targeting the platform-apis service running in the reefguard-eks EKS cluster. The service used the Jinja2 templating engine to render user-supplied template input and was running with root privileges.
By 11:56 PM, the attacker had read the pod’s service account token, exfiltrated data to webhook.site, minted three additional tokens across two namespaces, listed secrets, including those in kube-system, created a privileged pod on a worker node, and scheduled a CronJob to run every five minutes.
At 12:17 AM, a mesh VPN tunnel came online. Then the cluster went quiet.
On October 14, at 12:20 PM, a second source targeted the same /configs endpoint with another injection attack.
That pace is no longer unusual. With AI and autonomous agents, attackers can analyze each error response, adapt their exploitation strategy, and generate the next request in real time, without human intervention.
Security teams have traditionally relied on the window between initial access and persistence to investigate and contain an attack.
Your team shouldn’t have to rebuild the incident from 30 rows
Detection did its job here, with more than 30 detections firing across 16 resources, but they arrived as 30 rows in a queue, and the incident’s shape lives in the space between them.
Most teams still run the same review loop: they sort the queue by severity and spend an hour pivoting between a detections view and an inventory view, and then someone starts a thread to settle whether the privileged pod and the CronJob belong to the same incident.
The attacker spent 34 minutes, but reconstructing those 34 minutes has routinely taken longer than the attack did. Attackers now assemble chains faster than an analyst can narrate them, so the narration has to come from the platform.
What Is Story Replay
Upwind Story Replay, which we introduced a few weeks ago, plays a threat story back in the order it happened. When you open a threat story and press play, the detections that led to it unfold one after another.
The review above is one playthrough, and it covers nine steps across 27 days in under a minute. Each step carries its own timestamp and a name written the way you would say it out loud at a desk. You can scrub to any of them and stop there.
Story Graph shows the blast radius before you Press Play
Story Graph is what we are adding now, and it draws every detection on the resource it fired against, so the dataset config API, the platform-api pod, the token, the node, the CronJob, and the external destination each carry their own detection count and status badge: Exposed, Escalation, Host escape, Persistence, Exfil, C2, Abused, or Denied.
The graph opens with every resource and connection already drawn, faded, so you know how large the incident is in the first second.
Every edge is labeled with what happened along it, such as injects template, reads token, mints tokens, starts tunnel, or tries, refused, so nothing is left for you to infer between two alerts.
The graph also shows where paths converge. In a list, two routes into the same secrets node are just two rows that happen to mention secrets, but on the graph they are the reason containment has to cover both. Upwind Response does that within seconds of detection, while the remediation call stays yours.
Watch the same Attack on the Graph
Here is the incident above as it plays back on the graph.
Watch the dataset config API as it plays, because as long as that API renders untrusted input, the CronJob and the second source both have a way back in, and that puts it first in your containment order.
Contain the attack in the order the Graph shows
Whoever runs the response finds the order of work already on the graph:
- Close the template injection on /configs first, because two edges point back at it.
- Revoke the dataset-worker token and the three minted tokens, and revoke the connector-svc cluster-admin binding.
- Delete the dataset-sync CronJob and the csi-node-probe pod.
- Block webhook.site and the tailscaled tunnel.
- Read the seven denied calls and decide whether those controls hold on a second attempt.
You can see Story Replay and Story Graph on a live threat story in a demo.